NHL

Boston Bruins at Nashville Predators

· National Hockey League


Regular Season Series

BOS leads series 1-0

Statistics

https://a.espncdn.com/combiner/i?img=/i/teamlogos/nhl/500/bos.png&h=100&scale=crop&w=100&location=originBOS https://a.espncdn.com/combiner/i?img=/i/teamlogos/nhl/500/nsh.png&h=100&scale=crop&w=100&location=originNSH
2.29 Goals Against Average 3.08
27.4 Shots Against per Game 29.1
77.6 Penalty Kill Percentage 88.1
11 Power Play Goals Against 5
0 Short Handed Goals Against 0
3.57 Goals For per Game 2.85
25.9 Shots per Game 25.7
9 Power Play Goals 14
20.9 Power Play Percentage 31.8
0 Short Handed Goals 2
170 Penalty Minutes 96

Game Information

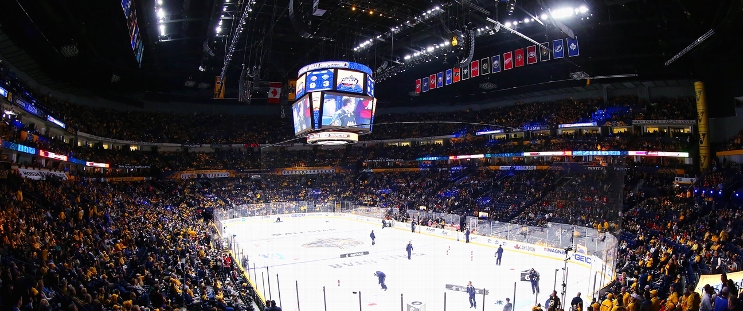
Bridgestone Arena

Location: Nashville, TN
Capacity:

2026-27 Atlantic Division Standings

TEAM W L PTS OTL
Boston 1 4 19 9
Montreal 2 3 18 8
Florida 2 4 18 8
Tampa Bay 1 3 17 8
Ottawa 1 5 17 8
Toronto 2 6 16 7
Buffalo 3 4 15 6
Detroit 3 4 15 6

2026-27 Central Division Standings

TEAM W L PTS OTL
Minnesota 3 3 21 9
Utah 0 5 18 9
Colorado 1 5 15 7
Dallas 1 5 15 7
St. Louis 1 6 13 6
Nashville 5 4 13 4
Winnipeg 3 7 11 4
Chicago 0 9 8 4
Full Standings
Bruins Last 5
Date OPP Result
@ DAL L 3-2 OT
vs NSH W 6-0
vs SJ W 6-4
@ CAR L 2-1
@ STL L 4-1
Predators Last 5
Date OPP Result
@ BOS L 6-0
@ PIT L 3-2 OT
vs COL W 6-2
vs NYI L 4-3 SO
vs WSH L 4-3