
Miami Marlins at Houston Astros
· Major League Baseball
3 - 5

Peña and Paredes homer, Imai fans eight as Astros get by Marlins 5-3

Imai (6-4) worked his fifth start with eight or more strikeouts and allowed one run on four hits and three walks. The 28-year-old rookie from Japan has surrendered three or fewer runs in four of his last five outings.
Peña's first-inning homer was originally a double, but the call was overturned by the umpires after video showed the ball hit a railing in left-center.
Lucas Spence extended the lead with a second-inning RBI double, but Kyle Stowers got the Marlins within one in the fifth with an RBI double.
The rally was short-lived, as Christian Vázquez reached on an error, Yordan Alvarez ran out a third-strike wild pitch, and Paredes swung on the first pitch he saw with two outs in the fifth for a 388-foot three-run homer to left field.
Joe Mack hit a 435-foot solo homer for the Marlins in the seventh.
The Marlins turned a 5-4-3 triple play in the eighth, after Jose Altuve hit a soft grounder directly to Leo Jiménez at third. Jiménez fired to Xavier Edwards at second, and Kyle Stowers took the throw at first. It was the first time the Astros hit into a triple play since 2019, and just the second time in franchise history the Marlins turned three.
Tyler Phillips (2-5) allowed three runs (two earned) on five hits in 4 1/3 innings. He struck out two and walked one.
The Astros won their second in a row and are 2/3 since the All-Star break, while the Marlins have lost five straight since the break.
How can I watch Miami Marlins vs. Houston Astros?
- TV Channel: Marlins at Astros 2022 MLB Baseball, is broadcasted on MLB.TV.
- Online streaming: Sign up for Fubo.
Scoring Summary
 |
9th Inning | Stowers popped out to third. |
|
9th Inning | Lopez grounded out to shortstop, Sanoja to third. |
|
9th Inning | Mack struck out looking. |
|
9th Inning | Sanoja hit a ground rule double. |
 |
9th Inning | Hader relieved Sousa |
|
9th Inning | Allen at second base. |
Statistics
 MIA |
 HOU |
|
|---|---|---|
| 1 | Games Played | 1 |
| 1 | Team Games Played | 1 |
| 0 | Hit By Pitch | 0 |
| 7 | Ground Balls | 11 |
| 13 | Strikeouts | 5 |
| 3 | Runs Batted In | 5 |
| 0 | Sacrifice Hit | 0 |
| 8 | Hits | 8 |
| 0 | Stolen Bases | 0 |
| 3 | Walks | 1 |
| 0 | Catcher Interference | 0 |
| 3 | Runs | 5 |
| 0 | Ground Into Double Play | 1 |
| 0 | Sacrifice Flies | 0 |
| 35 | At Bats | 30 |
| 1 | Home Runs | 2 |
| 0 | Grand Slam Home Runs | 0 |
| 11 | Runners Left On Base | 11 |
| 0 | Triples | 0 |
| 0 | Game Winning RBIs | 1 |
| 0 | Intentional Walks | 0 |
| 4 | Doubles | 1 |
| 15 | Fly Balls | 14 |
| 0 | Caught Stealing | 1 |
| 143 | Pitches | 118 |
| 0 | Games Started | 0 |
| 2 | Pinch At Bats | 0 |
| 0 | Pinch Hits | 0 |
| 0.0 | Player Rating | 0.0 |
| 1 | Is Qualified | 1 |
| 0 | Is Qualified In Steals | 1 |
| 15 | Total Bases | 15 |
| 38 | Plate Appearances | 31 |
| 162.0 | Projected Home Runs | 324.0 |
| 5 | Extra Base Hits | 3 |
| 4.5 | Runs Created | 3.6 |
| .229 | Batting Average | .267 |
| .000 | Pinch Hit Average | .000 |
| .429 | Slugging Percentage | .500 |
| .286 | Secondary Average | .233 |
| .289 | On Base Percentage | .290 |
| .718 | OBP Pct + SLG Pct | .790 |
| 0.5 | Ground To Fly Ball Ratio | 0.8 |
| 4.5 | Runs Created Per 27 Outs | 4.1 |
| 31.0 | Batter Rating | 36.0 |
| 35.0 | At Bats Per Home Run | 15.0 |
| 0.00 | Stolen Base Percentage | 0.00 |
| 3.76 | Pitches Per Plate Appearance | 3.81 |
| .200 | Isolated Power | .233 |
| 0.23 | Walk To Strikeout Ratio | 0.20 |
| .079 | Walks Per Plate Appearance | .032 |
| .057 | Secondary Average Minus Batting Average | -.033 |
| 6.0 | Runs Produced | 10.0 |
| 1.0 | Runs Ratio | 1.0 |
| 0.5 | Patience Ratio | 0.5 |
| 0.3 | Balls In Play Average | 0.3 |
| 78.8 | MLB Rating | 85.3 |
| 0.0 | Offensive Wins Above Replacement | 0.0 |
| 0.0 | Wins Above Replacement | 0.0 |
Game Information
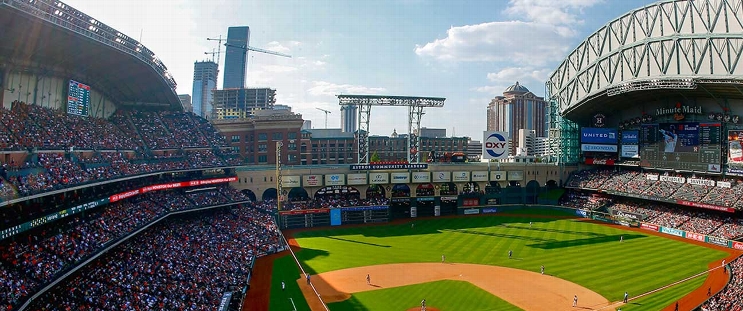
Location: Houston, Texas
Attendance: 28,748 | Capacity:
2026 National League East Standings
| TEAM | W | L | PCT | GB | STRK |
|---|---|---|---|---|---|
 Atlanta |
- | 68 | L1 | 0.5802469 | 94 |
 Philadelphia |
6 | 74 | W1 | 0.54320985 | 88 |
| Miami |
14 | 82 | W1 | 0.49382716 | 80 |
 Washington |
17 | 85 | W1 | 0.47530866 | 77 |
 New York |
20 | 88 | L1 | 0.45679012 | 74 |
2026 American League West Standings
| TEAM | W | L | PCT | GB | STRK |
|---|---|---|---|---|---|
| Houston |
- | 81 | W2 | 0.5 | 81 |
 Texas |
1 | 82 | L1 | 0.49382716 | 80 |
 Seattle |
5 | 86 | W2 | 0.4691358 | 76 |
 Athletics |
17 | 98 | L2 | 0.39506173 | 64 |
 Los Angeles |
19 | 100 | L2 | 0.38271606 | 62 |