
Athletics at Arizona Diamondbacks
· Major League Baseball
5 - 2

Jeff McNeil's pinch-hit single in the 7th inning sends the A's to a 5-2 win over the Diamondbacks

Athletics rookie Tommy White went 4 for 5 in his third major league game and beat out a comebacker that deflected off Kevin Ginkel (3-3) to load the bases with two outs. McNeil broke a 2-all tie with a two-run single, then wound up on third after he stole second on a wild pitch that allowed White to score for the final margin.
Nolan Arenado doubled with one out in the Arizona fifth for his 2,000th career hit. He became the 298th player to reach the milestone and the 21st third baseman.
A's rookie Joshua Kuroda-Grauer hit his first big league homer — a leadoff shot against rookie Mitch Bratt in the second to put the Athletics ahead — and Jacob Wilson led off the fifth with his sixth homer for a 2-0 lead.
Jorge Barrosa doubled leading off the sixth against Jeffrey Springs, and Ketel Marte followed with his 18th homer — a tying shot into the upper deck in left field.
Geraldo Perdomo had a bunt hit to chase Springs, who allowed two runs and six hits in five innings. The left-hander has given up 27 homers — most in the majors and one off his career high set last season. He is 0-9 in 16 starts since going 3-0 in his first four.
Luis Medina (2-1) pitched two scoreless innings for the win. Hogan Harris struck out the side and left two runners on in the ninth for his seventh save.
Bratt permitted two runs and eight hits over 4 2/3 innings in his third big league start. Ginkel got three outs and was charged with three runs.
How can I watch Athletics vs. Arizona Diamondbacks?
- TV Channel: Athletics at Diamondbacks 2022 MLB Baseball, is broadcasted on MLB.TV.
- Online streaming: Sign up for Fubo.
Scoring Summary
 |
9th Inning | Waldschmidt struck out looking. Athletics challenged: call on the field was overturned. |
|
9th Inning | Locklear walked. |
|
9th Inning | Moreno to second on fielder's indifference. |
|
9th Inning | Arenado struck out swinging. |
|
9th Inning | Vargas struck out swinging. |
|
9th Inning | Moreno singled to center. |
Statistics
 ATH |
 ARI |
|
|---|---|---|
| 1 | Games Played | 1 |
| 1 | Team Games Played | 1 |
| 2 | Hit By Pitch | 0 |
| 14 | Ground Balls | 7 |
| 7 | Strikeouts | 7 |
| 4 | Runs Batted In | 2 |
| 1 | Sacrifice Hit | 0 |
| 14 | Hits | 8 |
| 1 | Stolen Bases | 1 |
| 1 | Walks | 2 |
| 0 | Catcher Interference | 0 |
| 5 | Runs | 2 |
| 1 | Ground Into Double Play | 1 |
| 0 | Sacrifice Flies | 0 |
| 39 | At Bats | 33 |
| 2 | Home Runs | 1 |
| 0 | Grand Slam Home Runs | 0 |
| 26 | Runners Left On Base | 12 |
| 0 | Triples | 0 |
| 1 | Game Winning RBIs | 0 |
| 0 | Intentional Walks | 0 |
| 0 | Doubles | 2 |
| 19 | Fly Balls | 19 |
| 1 | Caught Stealing | 1 |
| 147 | Pitches | 152 |
| 0 | Games Started | 0 |
| 1 | Pinch At Bats | 0 |
| 1 | Pinch Hits | 0 |
| 0.0 | Player Rating | 0.0 |
| 1 | Is Qualified | 1 |
| 1 | Is Qualified In Steals | 1 |
| 20 | Total Bases | 13 |
| 43 | Plate Appearances | 35 |
| 324.0 | Projected Home Runs | 162.0 |
| 2 | Extra Base Hits | 3 |
| 7.3 | Runs Created | 3.2 |
| .359 | Batting Average | .242 |
| 1.000 | Pinch Hit Average | .000 |
| .513 | Slugging Percentage | .394 |
| .179 | Secondary Average | .212 |
| .405 | On Base Percentage | .286 |
| .918 | OBP Pct + SLG Pct | .680 |
| 0.7 | Ground To Fly Ball Ratio | 0.4 |
| 7.1 | Runs Created Per 27 Outs | 3.2 |
| 39.0 | Batter Rating | 24.0 |
| 19.5 | At Bats Per Home Run | 33.0 |
| 0.50 | Stolen Base Percentage | 0.50 |
| 3.42 | Pitches Per Plate Appearance | 4.34 |
| .154 | Isolated Power | .152 |
| 0.14 | Walk To Strikeout Ratio | 0.29 |
| .023 | Walks Per Plate Appearance | .057 |
| -.179 | Secondary Average Minus Batting Average | -.030 |
| 9.0 | Runs Produced | 4.0 |
| 0.8 | Runs Ratio | 1.0 |
| 0.6 | Patience Ratio | 0.4 |
| 0.4 | Balls In Play Average | 0.3 |
| 95.0 | MLB Rating | 76.5 |
| 0.0 | Offensive Wins Above Replacement | 0.0 |
| 0.0 | Wins Above Replacement | 0.0 |
Game Information
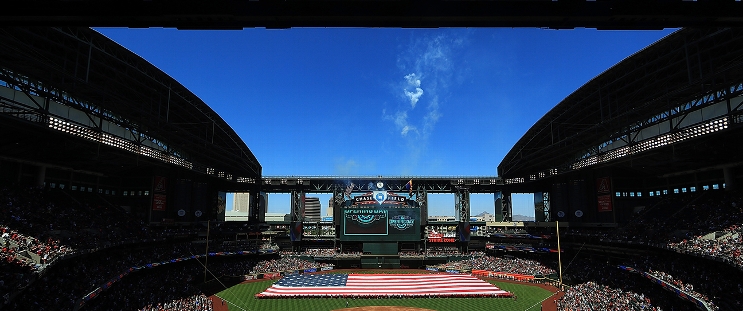
Location: Phoenix, Arizona
Attendance: 19,121 | Capacity:
2026 American League West Standings
| TEAM | W | L | PCT | GB | STRK |
|---|---|---|---|---|---|
 Houston |
- | 81 | W2 | 0.5 | 81 |
 Texas |
1 | 82 | L1 | 0.49382716 | 80 |
 Seattle |
5 | 86 | W2 | 0.4691358 | 76 |
| Athletics |
17 | 98 | L2 | 0.39506173 | 64 |
 Los Angeles |
19 | 100 | L2 | 0.38271606 | 62 |
2026 National League West Standings
| TEAM | W | L | PCT | GB | STRK |
|---|---|---|---|---|---|
 Los Angeles |
- | 62 | W3 | 0.61728394 | 100 |
 San Diego |
9 | 71 | W2 | 0.5617284 | 91 |
| Arizona |
14 | 76 | L2 | 0.5308642 | 86 |
 San Francisco |
35 | 97 | L5 | 0.40123457 | 65 |
 Colorado |
42 | 104 | L1 | 0.3580247 | 58 |