
Atlanta Braves at St. Louis Cardinals
· Major League Baseball
4 - 3

Braves rally in 9th for 4-3 victory over Cardinals

Moments before the decisive run scored, Cardinals manager Oliver Marmol was ejected after a failed challenge when JoJo Romero (1-3) hit Michael Harris II with a two-strike pitch with two outs.
Marmol's 23rd career ejection tied Whitey Herzog and Roger Bresnahan for second among Cardinals managers, trailing only Tony La Russa’s 39.
Mauricio Dubón followed with a routine grounder to shortstop, but the 2025 Gold Glover Winn’s throw to first was wild.
All-Star Raisel Iglesias closed with a perfect ninth inning for his 19th save. Tyler Kinley (5-3) earned the win.
Brewer Hicklen put Atlanta ahead 3-1 in the sixth with a double to left-center field for his first major league RBI and extra-base hit.
José Fermín tied it with a two-out, two-run single in the bottom of the sixth.
An overturned out call at home plate gave Atlanta its first lead in the fourth inning.
Austin Riley raced home from second on Drake Baldwin’s two-out single to right field, narrowly getting his left hand to the plate before catcher Jimmy Crooks tagged him on the back.
Cardinals starter Dustin May matched his season high with four walks in four innings, allowing two runs and two hits. The Braves’ first run came when May threw a wild pitch after walking the bases loaded in the second inning.
After opener Danny Young allowed Alec Burleson’s RBI double in the first, Braves rookie J.R. Ritchie pitched 4 1/3 innings of hitless relief before yielding Jordan Walker’s leadoff single that started the Cardinals’ rally in the sixth.
Cardinals: Begin a six-game road trip Friday at Arizona.
How can I watch Atlanta Braves vs. St. Louis Cardinals?
- TV Channel: Braves at Cardinals 2022 MLB Baseball, is broadcasted on MLB.TV.
- Online streaming: Sign up for Fubo.
Scoring Summary
 |
9th Inning | Crooks struck out swinging. |
|
9th Inning | Fermín grounded out to shortstop. |
|
9th Inning | Torres grounded out to pitcher. |
 |
9th Inning | Iglesias relieved Kinley |
|
9th Inning | Riley flied out to center. |
|
9th Inning | White walked. |
Statistics
 ATL |
 STL |
|
|---|---|---|
| 1 | Games Played | 1 |
| 1 | Team Games Played | 1 |
| 2 | Hit By Pitch | 0 |
| 13 | Ground Balls | 11 |
| 6 | Strikeouts | 9 |
| 2 | Runs Batted In | 3 |
| 1 | Sacrifice Hit | 0 |
| 7 | Hits | 4 |
| 1 | Stolen Bases | 1 |
| 6 | Walks | 5 |
| 0 | Catcher Interference | 0 |
| 4 | Runs | 3 |
| 1 | Ground Into Double Play | 0 |
| 0 | Sacrifice Flies | 0 |
| 34 | At Bats | 31 |
| 0 | Home Runs | 0 |
| 0 | Grand Slam Home Runs | 0 |
| 23 | Runners Left On Base | 10 |
| 0 | Triples | 0 |
| 0 | Game Winning RBIs | 0 |
| 0 | Intentional Walks | 0 |
| 3 | Doubles | 1 |
| 16 | Fly Balls | 11 |
| 0 | Caught Stealing | 0 |
| 176 | Pitches | 147 |
| 0 | Games Started | 0 |
| 1 | Pinch At Bats | 1 |
| 0 | Pinch Hits | 0 |
| 0.0 | Player Rating | 0.0 |
| 1 | Is Qualified | 1 |
| 1 | Is Qualified In Steals | 1 |
| 10 | Total Bases | 5 |
| 43 | Plate Appearances | 36 |
| 0.0 | Projected Home Runs | 0.0 |
| 3 | Extra Base Hits | 1 |
| 4.3 | Runs Created | 1.4 |
| .206 | Batting Average | .129 |
| .000 | Pinch Hit Average | .000 |
| .294 | Slugging Percentage | .161 |
| .294 | Secondary Average | .226 |
| .357 | On Base Percentage | .250 |
| .651 | OBP Pct + SLG Pct | .411 |
| 0.8 | Ground To Fly Ball Ratio | 1.0 |
| 4.0 | Runs Created Per 27 Outs | 1.4 |
| 26.0 | Batter Rating | 19.0 |
| 0.0 | At Bats Per Home Run | 0.0 |
| 1.00 | Stolen Base Percentage | 1.00 |
| 4.09 | Pitches Per Plate Appearance | 4.08 |
| .088 | Isolated Power | .032 |
| 1.00 | Walk To Strikeout Ratio | 0.56 |
| .140 | Walks Per Plate Appearance | .139 |
| .088 | Secondary Average Minus Batting Average | .097 |
| 6.0 | Runs Produced | 6.0 |
| 0.5 | Runs Ratio | 1.0 |
| 0.4 | Patience Ratio | 0.3 |
| 0.3 | Balls In Play Average | 0.2 |
| 76.3 | MLB Rating | 66.5 |
| 0.0 | Offensive Wins Above Replacement | 0.0 |
| 0.0 | Wins Above Replacement | 0.0 |
Game Information
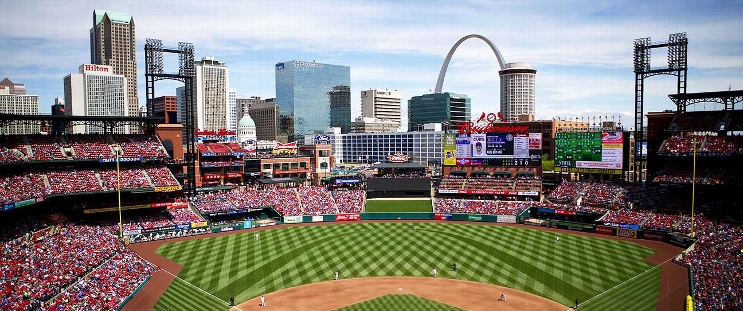
Location: St. Louis, Missouri
Attendance: 30,234 | Capacity:
2026 National League East Standings
| TEAM | W | L | PCT | GB | STRK |
|---|---|---|---|---|---|
| Atlanta |
- | 68 | L1 | 0.5802469 | 94 |
 Philadelphia |
6 | 74 | W1 | 0.54320985 | 88 |
 Miami |
14 | 82 | W1 | 0.49382716 | 80 |
 Washington |
17 | 85 | W1 | 0.47530866 | 77 |
 New York |
20 | 88 | L1 | 0.45679012 | 74 |
2026 National League Central Standings
| TEAM | W | L | PCT | GB | STRK |
|---|---|---|---|---|---|
 Milwaukee |
- | 59 | W5 | 0.63580245 | 103 |
 Chicago |
14 | 73 | W1 | 0.5493827 | 89 |
 Pittsburgh |
21 | 80 | W1 | 0.50617284 | 82 |
| St. Louis |
26 | 85 | L4 | 0.47530866 | 77 |
 Cincinnati |
28 | 87 | L1 | 0.46296296 | 75 |