
Atlanta Braves at St. Louis Cardinals
· Major League Baseball
1 - 4

Nootbaar, Liberatore spark Cardinals to 4-1 win over the Braves

Matthew Liberatore (5-6) allowed four hits over six scoreless innings, striking out six on 71 pitches. A double play helped him escape a sixth-inning jam with runners on first and third.
Riley O'Brien earned his 24th save in 28 chances despite allowing two baserunners in the ninth.
Reynaldo Lopez (4-2) made his fourth start since rejoining Atlanta’s rotation on June 26. He allowed four runs on five hits.
The Cardinals are 5-5 in their last 10 games. St. Louis has won four of five games against the Braves this season and clinched its second season series against Atlanta since 2018.
Atlanta has lost five of its last seven games.
Nootbaar’s two-out homer came in the first inning. Iván Herrera drew a one-out walk before Jordan Walker singled with two outs and extended his on-base streak to 17 games. Nootbaar hit a 1-2 curveball 435 feet into the right field bleachers.
St. Louis has hit 16 home runs in its last 11 games.
The Cardinals extended their lead to 4-0 in the fourth. Nootbaar led off with a walk, stole second and scored on a two-out single by Blaze Jordan.
Mauricio Dubón hit the first pitch from reliever Luis Gastelum 401 feet in the seventh inning, trimming the St. Louis lead to 4-1.
----
How can I watch Atlanta Braves vs. St. Louis Cardinals?
- TV Channel: Braves at Cardinals 2022 MLB Baseball, is broadcasted on MLB.TV.
- Online streaming: Sign up for Fubo.
Scoring Summary
 |
9th Inning | Bart struck out looking. |
|
9th Inning | Smith hit by pitch. |
|
9th Inning | Baldwin to second on fielder's indifference. |
|
9th Inning | Smith hit for White |
|
9th Inning | Riley lined out to center. |
|
9th Inning | Dubón lined out to second. |
Statistics
 ATL |
 STL |
|
|---|---|---|
| 1 | Games Played | 1 |
| 1 | Team Games Played | 1 |
| 1 | Hit By Pitch | 0 |
| 7 | Ground Balls | 13 |
| 11 | Strikeouts | 6 |
| 1 | Runs Batted In | 4 |
| 0 | Sacrifice Hit | 0 |
| 6 | Hits | 5 |
| 0 | Stolen Bases | 1 |
| 2 | Walks | 1 |
| 0 | Catcher Interference | 0 |
| 1 | Runs | 4 |
| 1 | Ground Into Double Play | 0 |
| 0 | Sacrifice Flies | 0 |
| 32 | At Bats | 29 |
| 1 | Home Runs | 1 |
| 0 | Grand Slam Home Runs | 0 |
| 15 | Runners Left On Base | 7 |
| 0 | Triples | 1 |
| 0 | Game Winning RBIs | 1 |
| 0 | Intentional Walks | 0 |
| 1 | Doubles | 0 |
| 14 | Fly Balls | 10 |
| 0 | Caught Stealing | 0 |
| 117 | Pitches | 132 |
| 0 | Games Started | 0 |
| 1 | Pinch At Bats | 0 |
| 0 | Pinch Hits | 0 |
| 0.0 | Player Rating | 0.0 |
| 1 | Is Qualified | 1 |
| 0 | Is Qualified In Steals | 1 |
| 10 | Total Bases | 10 |
| 35 | Plate Appearances | 30 |
| 162.0 | Projected Home Runs | 162.0 |
| 2 | Extra Base Hits | 2 |
| 2.2 | Runs Created | 2.1 |
| .188 | Batting Average | .172 |
| .000 | Pinch Hit Average | .000 |
| .313 | Slugging Percentage | .345 |
| .188 | Secondary Average | .241 |
| .257 | On Base Percentage | .200 |
| .570 | OBP Pct + SLG Pct | .545 |
| 0.5 | Ground To Fly Ball Ratio | 1.3 |
| 2.2 | Runs Created Per 27 Outs | 2.4 |
| 15.0 | Batter Rating | 27.5 |
| 32.0 | At Bats Per Home Run | 29.0 |
| 0.00 | Stolen Base Percentage | 1.00 |
| 3.34 | Pitches Per Plate Appearance | 4.40 |
| .125 | Isolated Power | .172 |
| 0.18 | Walk To Strikeout Ratio | 0.17 |
| .057 | Walks Per Plate Appearance | .033 |
| .000 | Secondary Average Minus Batting Average | .069 |
| 2.0 | Runs Produced | 8.0 |
| 1.0 | Runs Ratio | 1.0 |
| 0.4 | Patience Ratio | 0.4 |
| 0.3 | Balls In Play Average | 0.2 |
| 68.5 | MLB Rating | 75.0 |
| 0.0 | Offensive Wins Above Replacement | 0.0 |
| 0.0 | Wins Above Replacement | 0.0 |
Game Information
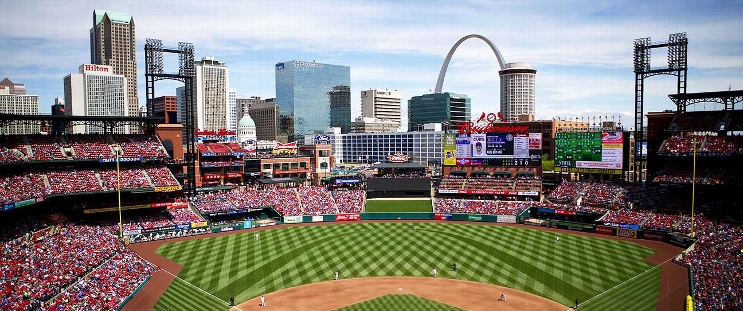
Location: St. Louis, Missouri
Attendance: 29,122 | Capacity:
2026 National League East Standings
| TEAM | W | L | PCT | GB | STRK |
|---|---|---|---|---|---|
| Atlanta |
- | 68 | L1 | 0.5802469 | 94 |
 Philadelphia |
6 | 74 | W1 | 0.54320985 | 88 |
 Miami |
14 | 82 | W1 | 0.49382716 | 80 |
 Washington |
17 | 85 | W1 | 0.47530866 | 77 |
 New York |
20 | 88 | L1 | 0.45679012 | 74 |
2026 National League Central Standings
| TEAM | W | L | PCT | GB | STRK |
|---|---|---|---|---|---|
 Milwaukee |
- | 59 | W5 | 0.63580245 | 103 |
 Chicago |
14 | 73 | W1 | 0.5493827 | 89 |
 Pittsburgh |
21 | 80 | W1 | 0.50617284 | 82 |
| St. Louis |
26 | 85 | L4 | 0.47530866 | 77 |
 Cincinnati |
28 | 87 | L1 | 0.46296296 | 75 |