
Baltimore Orioles at Cincinnati Reds
· Major League Baseball
8 - 5

Basallo hits a 3-run homer as the Orioles rough up Greene, beat the Reds 8-5

Gunnar Henderson extended his hitting streak to 10 games with a single on the first pitch of the game, Pete Alonso walked, and Basallo hit his 14th home run of the season.
The Reds pulled ahead 4-3 with a three-run second inning. Jose Trevino doubled home Spencer Steer, TJ Friedl followed with a triple to tie the game, and Elly De La Cruz put the Reds in the lead with a single against Brandon Young (7-2).
But the Orioles scored five times against Greene in the fourth. Adley Rutschman hit his second double of the game to drive in two runs and scored on Alonso’s second hit.
Greene (0-1), returning after surgery to remove bone chips from his elbow in March, lasted 3 1/3 innings, allowing eight runs, which ties a career-high, on seven hits. He walked four and struck out seven.
Young, who has won four of his last five decisions, allowed four runs on eight hits and three walks in five innings. He struck out five.
He gave up a walk to Steer and Trevino’s third hit to start the sixth, but Grant Wolfram relieved and induced a double play from Friedl to escape the inning.
Rhett Lowder, who was moved to the bullpen when Greene was added to the rotation, pitched three scoreless innings.
Tyler Wells pitched the ninth for his second save.
Chase Burns and Sal Stewart were named to the National League All-Star team. Stewart joins Frank Robinson, Johnny Bench, Chris Sabo and Scott Williamson as the only Reds rookies to be named All-Stars.
How can I watch Baltimore Orioles vs. Cincinnati Reds?
- TV Channel: Orioles at Reds 2022 MLB Baseball, is broadcasted on MLB.TV.
- Online streaming: Sign up for Fubo.
Scoring Summary
 |
9th Inning | Lowe flied out to shortstop. |
|
9th Inning | Suárez flied out to center. |
|
9th Inning | Bleday fouled out to third. |
|
9th Inning | Stewart walked, De La Cruz to second. |
|
9th Inning | De La Cruz singled to left. |
 |
9th Inning | Wells relieved Kittredge |
Statistics
 BAL |
 CIN |
|
|---|---|---|
| 1 | Games Played | 1 |
| 1 | Team Games Played | 1 |
| 0 | Hit By Pitch | 0 |
| 12 | Ground Balls | 13 |
| 9 | Strikeouts | 6 |
| 8 | Runs Batted In | 5 |
| 0 | Sacrifice Hit | 0 |
| 10 | Hits | 11 |
| 2 | Stolen Bases | 1 |
| 7 | Walks | 6 |
| 0 | Catcher Interference | 0 |
| 8 | Runs | 5 |
| 0 | Ground Into Double Play | 2 |
| 0 | Sacrifice Flies | 0 |
| 36 | At Bats | 35 |
| 1 | Home Runs | 0 |
| 0 | Grand Slam Home Runs | 0 |
| 19 | Runners Left On Base | 20 |
| 0 | Triples | 1 |
| 1 | Game Winning RBIs | 0 |
| 1 | Intentional Walks | 0 |
| 3 | Doubles | 2 |
| 15 | Fly Balls | 16 |
| 0 | Caught Stealing | 0 |
| 165 | Pitches | 156 |
| 0 | Games Started | 0 |
| 0 | Pinch At Bats | 0 |
| 0 | Pinch Hits | 0 |
| 0.0 | Player Rating | 0.0 |
| 1 | Is Qualified | 1 |
| 1 | Is Qualified In Steals | 1 |
| 16 | Total Bases | 15 |
| 43 | Plate Appearances | 41 |
| 162.0 | Projected Home Runs | 0.0 |
| 4 | Extra Base Hits | 3 |
| 7.2 | Runs Created | 6.1 |
| .278 | Batting Average | .314 |
| .000 | Pinch Hit Average | .000 |
| .444 | Slugging Percentage | .429 |
| .417 | Secondary Average | .314 |
| .395 | On Base Percentage | .415 |
| .840 | OBP Pct + SLG Pct | .843 |
| 0.8 | Ground To Fly Ball Ratio | 0.8 |
| 7.5 | Runs Created Per 27 Outs | 6.4 |
| 53.0 | Batter Rating | 38.5 |
| 36.0 | At Bats Per Home Run | 0.0 |
| 1.00 | Stolen Base Percentage | 1.00 |
| 3.84 | Pitches Per Plate Appearance | 3.80 |
| .167 | Isolated Power | .114 |
| 0.78 | Walk To Strikeout Ratio | 1.00 |
| .163 | Walks Per Plate Appearance | .146 |
| .139 | Secondary Average Minus Batting Average | .000 |
| 16.0 | Runs Produced | 10.0 |
| 1.0 | Runs Ratio | 1.0 |
| 0.6 | Patience Ratio | 0.5 |
| 0.3 | Balls In Play Average | 0.4 |
| 94.5 | MLB Rating | 89.3 |
| 0.0 | Offensive Wins Above Replacement | 0.0 |
| 0.0 | Wins Above Replacement | 0.0 |
Game Information
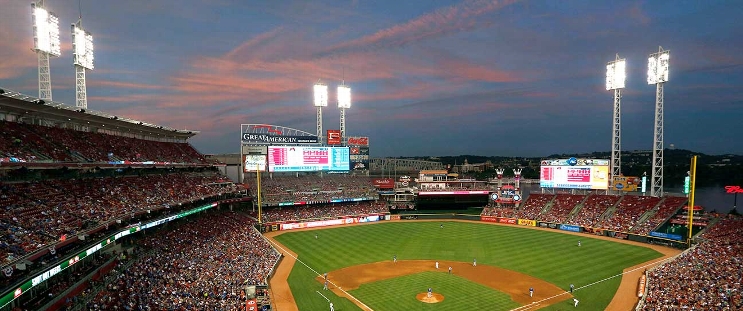
Location: Cincinnati, Ohio
Attendance: 33,047 | Capacity:
2026 American League East Standings
| TEAM | W | L | PCT | GB | STRK |
|---|---|---|---|---|---|
 Tampa Bay |
- | 64 | L1 | 0.60493827 | 98 |
 New York |
4.5 | 68 | W1 | 0.57763976 | 93 |
 Boston |
11 | 75 | L1 | 0.537037 | 87 |
| Baltimore |
18.5 | 82 | L1 | 0.49068323 | 79 |
 Toronto |
19 | 83 | W1 | 0.48765433 | 79 |
2026 National League Central Standings
| TEAM | W | L | PCT | GB | STRK |
|---|---|---|---|---|---|
 Milwaukee |
- | 59 | W5 | 0.63580245 | 103 |
 Chicago |
14 | 73 | W1 | 0.5493827 | 89 |
 Pittsburgh |
21 | 80 | W1 | 0.50617284 | 82 |
 St. Louis |
26 | 85 | L4 | 0.47530866 | 77 |
| Cincinnati |
28 | 87 | L1 | 0.46296296 | 75 |