
Pittsburgh Pirates at Washington Nationals
· Major League Baseball
5 - 9

García and Lile each homer twice as the Nationals rout the Pirates 9-5

Foster Griffin (9-2) allowed a run and four hits in five innings, lowering his ERA to 2.87 for the Nationals. Washington has won five of six.
Bryan Reynolds homered for Pittsburgh. Mitch Keller (6-6) allowed five runs and eight hits in six innings.
The temperature at game time was 100 degrees, and the ball was certainly carrying. García opened the scoring in the first with his 17th homer of the season, a solo shot to right. An inning later, Lile hit a 417-foot drive to center to make it 2-0.
Reynolds' solo homer to center in the third went 426 feet to get the Pirates on the board, but after James Wood led off the bottom half with a triple, Tena hit a two-run shot — also to center — that went 434 feet.
Lile's RBI double later that inning made it 5-1.
García connected again in the seventh, hitting a two-run shot off reliever Isaac Mattson. Lile's second homer was a two-run drive in the eighth.
Brandon Lowe, Reynolds and Esmerlyn Valdez hit consecutive RBI doubles in the ninth for the Pirates, and Nick Gonzales added another one an out later.
Griffin improved to 5-0 in his last nine starts, with the Nationals going 8-1 in those games. He's allowed one run or fewer in six straight outings, although he had only two strikeouts Friday, his fewest since April 11.
How can I watch Pittsburgh Pirates vs. Washington Nationals?
- TV Channel: Pirates at Nationals 2022 MLB Baseball, is broadcasted on MLB.TV.
- Online streaming: Sign up for Fubo.
Scoring Summary
 |
9th Inning | Mangum popped out to shortstop. |
|
9th Inning | Gonzales doubled to right, Valdez scored. |
|
9th Inning | O'Hearn grounded out to pitcher, Valdez to third. |
|
9th Inning | Valdez doubled to right, Reynolds scored. |
|
9th Inning | Reynolds doubled to center, Lowe scored. |
|
9th Inning | Lowe doubled to right, Triolo scored. |
Statistics
 PIT |
 WSH |
|
|---|---|---|
| 1 | Games Played | 1 |
| 1 | Team Games Played | 1 |
| 0 | Hit By Pitch | 0 |
| 14 | Ground Balls | 8 |
| 7 | Strikeouts | 2 |
| 5 | Runs Batted In | 9 |
| 0 | Sacrifice Hit | 0 |
| 13 | Hits | 12 |
| 4 | Stolen Bases | 1 |
| 3 | Walks | 3 |
| 0 | Catcher Interference | 0 |
| 5 | Runs | 9 |
| 1 | Ground Into Double Play | 0 |
| 0 | Sacrifice Flies | 0 |
| 40 | At Bats | 36 |
| 1 | Home Runs | 5 |
| 0 | Grand Slam Home Runs | 0 |
| 19 | Runners Left On Base | 11 |
| 0 | Triples | 1 |
| 0 | Game Winning RBIs | 1 |
| 0 | Intentional Walks | 0 |
| 6 | Doubles | 2 |
| 19 | Fly Balls | 26 |
| 0 | Caught Stealing | 0 |
| 176 | Pitches | 141 |
| 0 | Games Started | 0 |
| 0 | Pinch At Bats | 0 |
| 0 | Pinch Hits | 0 |
| 0.0 | Player Rating | 0.0 |
| 1 | Is Qualified | 1 |
| 1 | Is Qualified In Steals | 1 |
| 22 | Total Bases | 31 |
| 43 | Plate Appearances | 39 |
| 162.0 | Projected Home Runs | 810.0 |
| 7 | Extra Base Hits | 8 |
| 8.4 | Runs Created | 11.1 |
| .325 | Batting Average | .333 |
| .000 | Pinch Hit Average | .000 |
| .550 | Slugging Percentage | .861 |
| .400 | Secondary Average | .639 |
| .372 | On Base Percentage | .385 |
| .922 | OBP Pct + SLG Pct | 1.246 |
| 0.7 | Ground To Fly Ball Ratio | 0.3 |
| 8.1 | Runs Created Per 27 Outs | 12.5 |
| 52.0 | Batter Rating | 70.5 |
| 40.0 | At Bats Per Home Run | 7.2 |
| 1.00 | Stolen Base Percentage | 1.00 |
| 4.09 | Pitches Per Plate Appearance | 3.62 |
| .225 | Isolated Power | .528 |
| 0.43 | Walk To Strikeout Ratio | 1.50 |
| .070 | Walks Per Plate Appearance | .077 |
| .075 | Secondary Average Minus Batting Average | .306 |
| 10.0 | Runs Produced | 18.0 |
| 1.0 | Runs Ratio | 1.0 |
| 0.6 | Patience Ratio | 0.9 |
| 0.4 | Balls In Play Average | 0.2 |
| 97.3 | MLB Rating | 114.5 |
| 0.0 | Offensive Wins Above Replacement | 0.0 |
| 0.0 | Wins Above Replacement | 0.0 |
Game Information
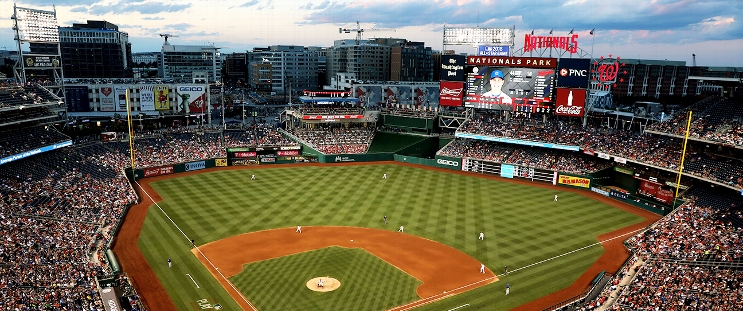
Location: Washington, District of Columbia
Attendance: 30,331 | Capacity:
2026 National League Central Standings
| TEAM | W | L | PCT | GB | STRK |
|---|---|---|---|---|---|
 Milwaukee |
- | 59 | W5 | 0.63580245 | 103 |
 Chicago |
14 | 73 | W1 | 0.5493827 | 89 |
| Pittsburgh |
21 | 80 | W1 | 0.50617284 | 82 |
 St. Louis |
26 | 85 | L4 | 0.47530866 | 77 |
 Cincinnati |
28 | 87 | L1 | 0.46296296 | 75 |
2026 National League East Standings
| TEAM | W | L | PCT | GB | STRK |
|---|---|---|---|---|---|
 Atlanta |
- | 68 | L1 | 0.5802469 | 94 |
 Philadelphia |
6 | 74 | W1 | 0.54320985 | 88 |
 Miami |
14 | 82 | W1 | 0.49382716 | 80 |
| Washington |
17 | 85 | W1 | 0.47530866 | 77 |
 New York |
20 | 88 | L1 | 0.45679012 | 74 |