
Miami Marlins at St. Louis Cardinals
· Major League Baseball
1 - 2

Torres hits 2-run homer to help Leahy and Cardinals cool off Marlins with 2-1 win

Masyn Winn led off the second inning with a single against Tyler Phillips (1-3) and Torres followed with his third home run for a 2-0 lead.
Leahy (6-4) didn’t allow a hit until Owen Caissie and Graham Paulie had back-to-back doubles to begin the fifth, cutting it to 2-1. Leahy allowed one run on two hits with three walks in five innings.
JoJo Romero got four outs and Ryne Stanek induced an inning-ending double play in the seventh. George Soriano struck out two in a perfect eighth and Riley O'Brien retired the side in order in the ninth for his 20th save in 24 opportunities.
Phillips set down 12 in a row following Torres' homer until JJ Wetherholt led off the sixth with a single. Iván Herrera grounded into a double play four pitches later and Alec Burleson bounced out to end the inning.
Burleson's 25-game on-base streak ended and Herrera's 22-game run was also stopped.
Phillips allowed two runs and six hits in a season-high 7 1/3 innings. He left in favor of Cade Gibson with runners at the corners, and catcher Joe Mack picked off Nathan Church at third base before Gibson struck out Wetherholt on the next pitch to end the inning.
The Cardinals (43-38) scored just three runs in the three-game series but avoided being swept by the Marlins at home for the first time in 30 years.
Miami (44-40) is 18-6 in June — best in the majors — and has won seven of its last eight series.
Cardinals LHP Matthew Liberatore (3-5, 5.56 ERA) pitches Tuesday at Atlanta.
How can I watch Miami Marlins vs. St. Louis Cardinals?
- TV Channel: Marlins at Cardinals 2022 MLB Baseball, is broadcasted on MLB.TV.
- Online streaming: Sign up for Fubo.
Scoring Summary
 |
9th Inning | Sanoja grounded out to first. |
|
9th Inning | Hernández struck out looking. Miami Marlins challenged: call on the field was upheld. |
|
9th Inning | Edwards flied out to center. |
 |
9th Inning | O'Brien relieved Soriano |
|
8th Inning | Wetherholt struck out swinging. |
|
8th Inning | Church picked off third. St Louis Cardinals challenged: call on the field was upheld. |
Statistics
 MIA |
 STL |
|
|---|---|---|
| 1 | Games Played | 1 |
| 1 | Team Games Played | 1 |
| 0 | Hit By Pitch | 0 |
| 9 | Ground Balls | 13 |
| 9 | Strikeouts | 2 |
| 1 | Runs Batted In | 2 |
| 1 | Sacrifice Hit | 0 |
| 4 | Hits | 6 |
| 1 | Stolen Bases | 1 |
| 3 | Walks | 0 |
| 0 | Catcher Interference | 0 |
| 1 | Runs | 2 |
| 1 | Ground Into Double Play | 1 |
| 0 | Sacrifice Flies | 0 |
| 29 | At Bats | 28 |
| 0 | Home Runs | 1 |
| 0 | Grand Slam Home Runs | 0 |
| 11 | Runners Left On Base | 5 |
| 0 | Triples | 0 |
| 0 | Game Winning RBIs | 1 |
| 0 | Intentional Walks | 0 |
| 2 | Doubles | 0 |
| 12 | Fly Balls | 13 |
| 0 | Caught Stealing | 0 |
| 141 | Pitches | 104 |
| 0 | Games Started | 0 |
| 4 | Pinch At Bats | 0 |
| 1 | Pinch Hits | 0 |
| 0.0 | Player Rating | 0.0 |
| 1 | Is Qualified | 1 |
| 1 | Is Qualified In Steals | 1 |
| 6 | Total Bases | 9 |
| 33 | Plate Appearances | 28 |
| 0.0 | Projected Home Runs | 162.0 |
| 2 | Extra Base Hits | 1 |
| 0.9 | Runs Created | 1.6 |
| .138 | Batting Average | .214 |
| .250 | Pinch Hit Average | .000 |
| .207 | Slugging Percentage | .321 |
| .207 | Secondary Average | .143 |
| .219 | On Base Percentage | .214 |
| .426 | OBP Pct + SLG Pct | .536 |
| 0.8 | Ground To Fly Ball Ratio | 1.0 |
| 0.9 | Runs Created Per 27 Outs | 1.9 |
| 13.0 | Batter Rating | 18.0 |
| 0.0 | At Bats Per Home Run | 28.0 |
| 1.00 | Stolen Base Percentage | 1.00 |
| 4.27 | Pitches Per Plate Appearance | 3.71 |
| .069 | Isolated Power | .107 |
| 0.33 | Walk To Strikeout Ratio | 0.00 |
| .091 | Walks Per Plate Appearance | .000 |
| .069 | Secondary Average Minus Batting Average | -.071 |
| 2.0 | Runs Produced | 4.0 |
| 1.0 | Runs Ratio | 1.0 |
| 0.3 | Patience Ratio | 0.3 |
| 0.2 | Balls In Play Average | 0.2 |
| 63.8 | MLB Rating | 72.3 |
| 0.0 | Offensive Wins Above Replacement | 0.0 |
| 0.0 | Wins Above Replacement | 0.0 |
Game Information
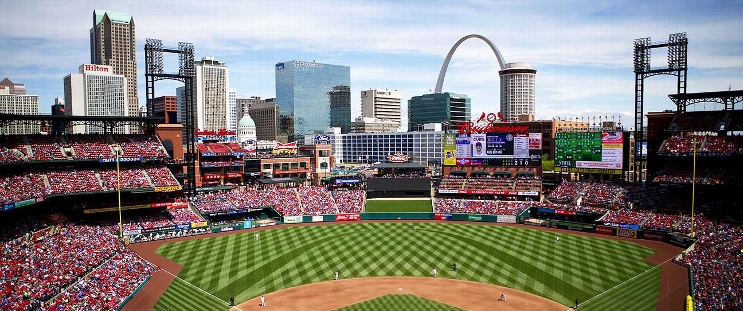
Location: St. Louis, Missouri
Attendance: 37,779 | Capacity:
2026 National League East Standings
| TEAM | W | L | PCT | GB | STRK |
|---|---|---|---|---|---|
 Atlanta |
- | 68 | L1 | 0.5802469 | 94 |
 Philadelphia |
6 | 74 | W1 | 0.54320985 | 88 |
| Miami |
14 | 82 | W1 | 0.49382716 | 80 |
 Washington |
17 | 85 | W1 | 0.47530866 | 77 |
 New York |
20 | 88 | L1 | 0.45679012 | 74 |
2026 National League Central Standings
| TEAM | W | L | PCT | GB | STRK |
|---|---|---|---|---|---|
 Milwaukee |
- | 59 | W5 | 0.63580245 | 103 |
 Chicago |
14 | 73 | W1 | 0.5493827 | 89 |
 Pittsburgh |
21 | 80 | W1 | 0.50617284 | 82 |
| St. Louis |
26 | 85 | L4 | 0.47530866 | 77 |
 Cincinnati |
28 | 87 | L1 | 0.46296296 | 75 |