
New York Yankees at Detroit Tigers
· Major League Baseball
4 - 3

Jazz Chisholm Jr.'s big night at the plate helps Yankees end 3-game skid with 4-3 win over Tigers

Chisholm scored on Jose Caballero's RBI groundout in the fourth inning before hitting a two-run homer in the sixth as New York ended a three-game losing streak and stopped Detroit's four-game winning streak.
Carlos Rodón (4-2) picked up the win, allowing three runs and six hits with two walks in 5 1/3 innings. Three relievers finished, with David Bednar getting the final four outs for his 15th save.
Casey Mize (2-5) gave up four runs and eight hits and a walk in 5 2/3 innings. He struck out six while giving the Tigers their 27th straight game in which the starting pitcher allowed four or fewer runs.
Detroit took the lead with two runs in the third. Zach McKinstry hit a one-out single and took third when Ben Malgeri singled in his first major-league at-bat. McKinstry scored on Rodon's wild pitch and Malgeri came home on Dillon Dingler's base hit.
After Caballero made it 2-1 with his run-scoring groundout in the fourth, Cody Bellinger threw out Riley Greene at the plate to end the bottom of the inning.
The Yankees went up 4-2 with three runs in the sixth. With one out, Paul Goldschmidt beat out a rare infield single before Chisholm homered to right-center. Caballero's two-out single brought Tyler Holton out of the bullpen, but Austin Wells doubled to give the Yankees a two-run lead.
Dingler and Matt Vierling started the bottom of the inning with back-to-back doubles, cutting New York's lead to 4-3.
—
How can I watch New York Yankees vs. Detroit Tigers?
- TV Channel: Yankees at Tigers 2022 MLB Baseball, is broadcasted on MLB.TV.
- Online streaming: Sign up for Fubo.
Scoring Summary
 |
9th Inning | McKinstry flied out to left. |
|
9th Inning | Keith grounded out to second. |
|
9th Inning | Carpenter flied out to center. |
 |
9th Inning | Rice flied out to left. |
|
9th Inning | Volpe grounded out to pitcher. |
|
9th Inning | Wells struck out swinging. |
Statistics
 NYY |
 DET |
|
|---|---|---|
| 1 | Games Played | 1 |
| 1 | Team Games Played | 1 |
| 0 | Hit By Pitch | 0 |
| 11 | Ground Balls | 8 |
| 13 | Strikeouts | 7 |
| 4 | Runs Batted In | 2 |
| 0 | Sacrifice Hit | 0 |
| 9 | Hits | 8 |
| 2 | Stolen Bases | 0 |
| 2 | Walks | 3 |
| 0 | Catcher Interference | 0 |
| 4 | Runs | 3 |
| 0 | Ground Into Double Play | 0 |
| 0 | Sacrifice Flies | 0 |
| 35 | At Bats | 32 |
| 1 | Home Runs | 0 |
| 0 | Grand Slam Home Runs | 0 |
| 12 | Runners Left On Base | 13 |
| 0 | Triples | 0 |
| 1 | Game Winning RBIs | 0 |
| 0 | Intentional Walks | 0 |
| 2 | Doubles | 2 |
| 11 | Fly Balls | 17 |
| 1 | Caught Stealing | 0 |
| 146 | Pitches | 143 |
| 0 | Games Started | 0 |
| 0 | Pinch At Bats | 1 |
| 0 | Pinch Hits | 0 |
| 0.0 | Player Rating | 0.0 |
| 1 | Is Qualified | 1 |
| 1 | Is Qualified In Steals | 0 |
| 14 | Total Bases | 10 |
| 37 | Plate Appearances | 35 |
| 162.0 | Projected Home Runs | 0.0 |
| 3 | Extra Base Hits | 2 |
| 4.2 | Runs Created | 3.4 |
| .257 | Batting Average | .250 |
| .000 | Pinch Hit Average | .000 |
| .400 | Slugging Percentage | .313 |
| .229 | Secondary Average | .156 |
| .297 | On Base Percentage | .314 |
| .697 | OBP Pct + SLG Pct | .627 |
| 1.0 | Ground To Fly Ball Ratio | 0.5 |
| 4.2 | Runs Created Per 27 Outs | 3.8 |
| 34.0 | Batter Rating | 22.0 |
| 35.0 | At Bats Per Home Run | 0.0 |
| 0.67 | Stolen Base Percentage | 0.00 |
| 3.95 | Pitches Per Plate Appearance | 4.09 |
| .143 | Isolated Power | .063 |
| 0.15 | Walk To Strikeout Ratio | 0.43 |
| .054 | Walks Per Plate Appearance | .086 |
| -.029 | Secondary Average Minus Batting Average | -.094 |
| 8.0 | Runs Produced | 5.0 |
| 1.0 | Runs Ratio | 0.7 |
| 0.4 | Patience Ratio | 0.4 |
| 0.4 | Balls In Play Average | 0.3 |
| 81.0 | MLB Rating | 75.0 |
| 0.0 | Offensive Wins Above Replacement | 0.0 |
| 0.0 | Wins Above Replacement | 0.0 |
Game Information
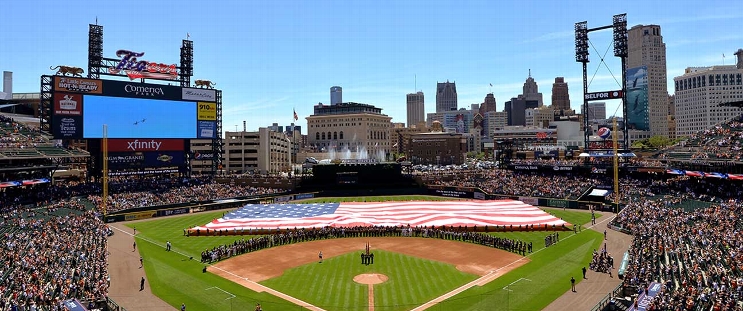
Location: Detroit, Michigan
Attendance: 27,157 | Capacity:
2026 American League East Standings
| TEAM | W | L | PCT | GB | STRK |
|---|---|---|---|---|---|
 Tampa Bay |
- | 64 | L1 | 0.60493827 | 98 |
| New York |
4.5 | 68 | W1 | 0.57763976 | 93 |
 Boston |
11 | 75 | L1 | 0.537037 | 87 |
 Baltimore |
18.5 | 82 | L1 | 0.49068323 | 79 |
 Toronto |
19 | 83 | W1 | 0.48765433 | 79 |
2026 American League Central Standings
| TEAM | W | L | PCT | GB | STRK |
|---|---|---|---|---|---|
 Cleveland |
- | 77 | L1 | 0.52469134 | 85 |
 Chicago |
1 | 78 | W1 | 0.5185185 | 84 |
 Minnesota |
8 | 85 | W1 | 0.47530866 | 77 |
| Detroit |
9 | 86 | L1 | 0.4691358 | 76 |
 Kansas City |
16 | 93 | W1 | 0.42592594 | 69 |