
Arizona Diamondbacks at St. Louis Cardinals
· Major League Baseball
2 - 3

Wetherholt, Church, Pallante key Cardinals' 3-2 win over Diamondbacks

Andre Pallante (9-4) allowed six hits and one run in six innings to secure the victory.
Pallante has earned wins in his last four starts and has given up two runs or less in five of his last six outings. St. Louis has won all five of those games.
Riley O'Brien, the fifth Cardinals pitcher, notched his 19th save in 23 opportunities by working the ninth.
Merrill Kelly (5-7) pitched six innings, giving up three runs on seven hits.
Ketel Marte and Corbin Carroll each had two hits for Arizona.
St. Louis took a 1-0 lead in the third on a one-out infield single by Alec Burleson that drove in Church.
The Cardinals extended their lead to 3-0 with a two-run fourth. Blaze Jordan’s sacrifice fly to deep center scored Jimmy Croocks. Church followed with a run-scoring single to shallow center, driving in Masyn Winn.
Nolan Arenado made his first appearance in St. Louis since he was traded in January. Arenado played five seasons with the Cardinals. Many fans gave him a standing ovation before his first at-bat in the second and then he singled to left.
Arenado drove in a run with a sixth-inning groundout, cutting St. Louis' lead to 3-1.
The second Diamondbacks run came on a 440-foot homer to center by Tommy Troy in seventh off reliever Ryne Stanek, who was making his 500th career appearance. Stanek is one of 13 active pitchers with 500 games.
How can I watch Arizona Diamondbacks vs. St. Louis Cardinals?
- TV Channel: Diamondbacks at Cardinals 2022 MLB Baseball, is broadcasted on MLB.TV.
- Online streaming: Sign up for Fubo.
Scoring Summary
 |
9th Inning | Troy fouled out to catcher. |
|
9th Inning | Gurriel Jr. lined out to center. |
|
9th Inning | Del Castillo grounded out to shortstop. |
 |
9th Inning | O'Brien relieved Soriano |
|
8th Inning | Winn lined out to right. |
|
8th Inning | Loaisiga relieved Clarke |
Statistics
 ARI |
 STL |
|
|---|---|---|
| 1 | Games Played | 1 |
| 1 | Team Games Played | 1 |
| 1 | Hit By Pitch | 1 |
| 17 | Ground Balls | 12 |
| 2 | Strikeouts | 4 |
| 2 | Runs Batted In | 3 |
| 0 | Sacrifice Hit | 0 |
| 8 | Hits | 7 |
| 1 | Stolen Bases | 1 |
| 0 | Walks | 4 |
| 0 | Catcher Interference | 0 |
| 2 | Runs | 3 |
| 0 | Ground Into Double Play | 2 |
| 0 | Sacrifice Flies | 1 |
| 34 | At Bats | 27 |
| 1 | Home Runs | 0 |
| 0 | Grand Slam Home Runs | 0 |
| 15 | Runners Left On Base | 14 |
| 0 | Triples | 0 |
| 0 | Game Winning RBIs | 1 |
| 0 | Intentional Walks | 0 |
| 2 | Doubles | 0 |
| 15 | Fly Balls | 12 |
| 0 | Caught Stealing | 0 |
| 127 | Pitches | 127 |
| 0 | Games Started | 0 |
| 1 | Pinch At Bats | 0 |
| 0 | Pinch Hits | 0 |
| 0.0 | Player Rating | 0.0 |
| 1 | Is Qualified | 1 |
| 1 | Is Qualified In Steals | 1 |
| 13 | Total Bases | 7 |
| 35 | Plate Appearances | 33 |
| 162.0 | Projected Home Runs | 0.0 |
| 3 | Extra Base Hits | 0 |
| 3.6 | Runs Created | 2.8 |
| .235 | Batting Average | .259 |
| .000 | Pinch Hit Average | .000 |
| .382 | Slugging Percentage | .259 |
| .176 | Secondary Average | .185 |
| .257 | On Base Percentage | .364 |
| .639 | OBP Pct + SLG Pct | .623 |
| 1.1 | Ground To Fly Ball Ratio | 1.0 |
| 3.7 | Runs Created Per 27 Outs | 3.3 |
| 24.0 | Batter Rating | 20.0 |
| 34.0 | At Bats Per Home Run | 0.0 |
| 1.00 | Stolen Base Percentage | 1.00 |
| 3.63 | Pitches Per Plate Appearance | 3.85 |
| .147 | Isolated Power | .000 |
| 0.00 | Walk To Strikeout Ratio | 1.00 |
| .000 | Walks Per Plate Appearance | .121 |
| -.059 | Secondary Average Minus Batting Average | -.074 |
| 4.0 | Runs Produced | 6.0 |
| 1.0 | Runs Ratio | 1.0 |
| 0.4 | Patience Ratio | 0.4 |
| 0.2 | Balls In Play Average | 0.3 |
| 77.5 | MLB Rating | 74.8 |
| 0.0 | Offensive Wins Above Replacement | 0.0 |
| 0.0 | Wins Above Replacement | 0.0 |
Game Information
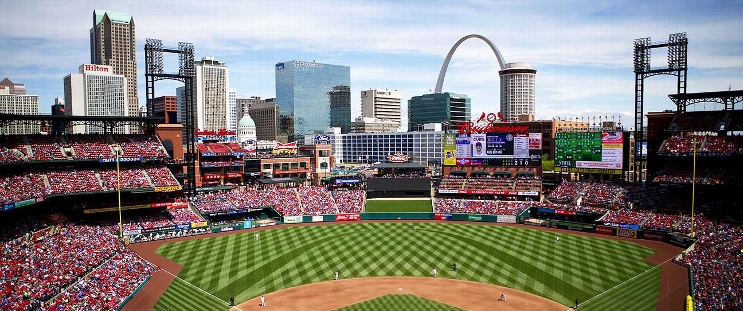
Location: St. Louis, Missouri
Attendance: 22,050 | Capacity:
2026 National League West Standings
| TEAM | W | L | PCT | GB | STRK |
|---|---|---|---|---|---|
 Los Angeles |
- | 62 | W3 | 0.61728394 | 100 |
 San Diego |
9 | 71 | W2 | 0.5617284 | 91 |
| Arizona |
14 | 76 | L2 | 0.5308642 | 86 |
 San Francisco |
35 | 97 | L5 | 0.40123457 | 65 |
 Colorado |
42 | 104 | L1 | 0.3580247 | 58 |
2026 National League Central Standings
| TEAM | W | L | PCT | GB | STRK |
|---|---|---|---|---|---|
 Milwaukee |
- | 59 | W5 | 0.63580245 | 103 |
 Chicago |
14 | 73 | W1 | 0.5493827 | 89 |
 Pittsburgh |
21 | 80 | W1 | 0.50617284 | 82 |
| St. Louis |
26 | 85 | L4 | 0.47530866 | 77 |
 Cincinnati |
28 | 87 | L1 | 0.46296296 | 75 |