
San Francisco Giants at Atlanta Braves
· Major League Baseball
San Francisco Giants
31-43, 17-23 Away
Final
7 - 5
7 - 5

Atlanta Braves
46-27, 22-13 HomeHow To Watch
How can I watch San Francisco Giants vs. Atlanta Braves?
- TV Channel: Giants at Braves 2022 MLB Baseball, is broadcasted on MLB.TV.
- Online streaming: Sign up for Fubo.
Scoring Summary
 |
9th Inning | Riley struck out swinging. |
|
9th Inning | Albies grounded out to first, Olson to third. |
|
9th Inning | Baldwin scored on Beck wild pitch, Olson to second on wild pitch by Beck. |
 |
9th Inning | Beck relieved Gage |
|
9th Inning | Olson singled to center, Baldwin to third. |
|
9th Inning | Baldwin singled to right. |
Statistics
 SF |
 ATL |
|
|---|---|---|
| 1 | Games Played | 1 |
| 1 | Team Games Played | 1 |
| 1 | Hit By Pitch | 0 |
| 13 | Ground Balls | 14 |
| 6 | Strikeouts | 7 |
| 7 | Runs Batted In | 4 |
| 1 | Sacrifice Hit | 0 |
| 9 | Hits | 12 |
| 2 | Stolen Bases | 0 |
| 3 | Walks | 2 |
| 0 | Catcher Interference | 0 |
| 7 | Runs | 5 |
| 0 | Ground Into Double Play | 0 |
| 0 | Sacrifice Flies | 1 |
| 34 | At Bats | 38 |
| 3 | Home Runs | 1 |
| 0 | Grand Slam Home Runs | 0 |
| 13 | Runners Left On Base | 22 |
| 0 | Triples | 0 |
| 1 | Game Winning RBIs | 0 |
| 0 | Intentional Walks | 0 |
| 2 | Doubles | 1 |
| 16 | Fly Balls | 18 |
| 1 | Caught Stealing | 0 |
| 145 | Pitches | 162 |
| 0 | Games Started | 0 |
| 0 | Pinch At Bats | 2 |
| 0 | Pinch Hits | 0 |
| 0.0 | Player Rating | 0.0 |
| 1 | Is Qualified | 1 |
| 1 | Is Qualified In Steals | 0 |
| 20 | Total Bases | 16 |
| 39 | Plate Appearances | 41 |
| 486.0 | Projected Home Runs | 162.0 |
| 5 | Extra Base Hits | 2 |
| 6.9 | Runs Created | 5.7 |
| .265 | Batting Average | .316 |
| .000 | Pinch Hit Average | .000 |
| .588 | Slugging Percentage | .421 |
| .441 | Secondary Average | .158 |
| .342 | On Base Percentage | .341 |
| .930 | OBP Pct + SLG Pct | .763 |
| 0.8 | Ground To Fly Ball Ratio | 0.8 |
| 6.9 | Runs Created Per 27 Outs | 5.7 |
| 52.0 | Batter Rating | 35.0 |
| 11.3 | At Bats Per Home Run | 38.0 |
| 0.67 | Stolen Base Percentage | 0.00 |
| 3.72 | Pitches Per Plate Appearance | 3.95 |
| .324 | Isolated Power | .105 |
| 0.50 | Walk To Strikeout Ratio | 0.29 |
| .077 | Walks Per Plate Appearance | .049 |
| .176 | Secondary Average Minus Batting Average | -.158 |
| 14.0 | Runs Produced | 9.0 |
| 1.0 | Runs Ratio | 0.8 |
| 0.7 | Patience Ratio | 0.4 |
| 0.2 | Balls In Play Average | 0.4 |
| 95.8 | MLB Rating | 88.5 |
| 0.0 | Offensive Wins Above Replacement | 0.0 |
| 0.0 | Wins Above Replacement | 0.0 |
Game Information
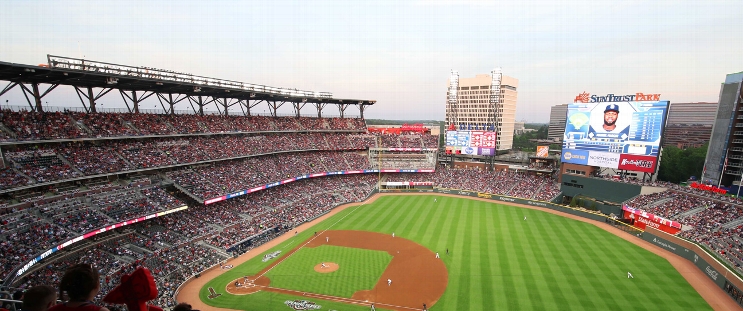
Truist Park
Location: Atlanta, Georgia
Attendance: 35,449 | Capacity:
2026 National League West Standings
| TEAM | W | L | PCT | GB | STRK |
|---|---|---|---|---|---|
 Los Angeles |
- | 62 | W3 | 0.61728394 | 100 |
 San Diego |
9 | 71 | W2 | 0.5617284 | 91 |
 Arizona |
14 | 76 | L2 | 0.5308642 | 86 |
| San Francisco |
35 | 97 | L5 | 0.40123457 | 65 |
 Colorado |
42 | 104 | L1 | 0.3580247 | 58 |
2026 National League East Standings
| TEAM | W | L | PCT | GB | STRK |
|---|---|---|---|---|---|
| Atlanta |
- | 68 | L1 | 0.5802469 | 94 |
 Philadelphia |
6 | 74 | W1 | 0.54320985 | 88 |
 Miami |
14 | 82 | W1 | 0.49382716 | 80 |
 Washington |
17 | 85 | W1 | 0.47530866 | 77 |
 New York |
20 | 88 | L1 | 0.45679012 | 74 |