
New York Mets at Cincinnati Reds
· Major League Baseball
9 - 1

Bichette has 3 hits, McLean strikes out 9 as Mets beat Reds 9-1 to avoid series sweep

Francisco Alvarez and Juan Soto also had three hits apiece. New York had 15 hits, which is tied for its second-highest output of the season.
Bichette has multiple hits in six straight games and went 8 for 14 in the three-game series. The third baseman is also batting .539 (14 for 26) over his last six games with two homers and eight RBI.
McLean (4-4) allowed one unearned run and three hits as he went seven innings for the third time in 15 starts.
It was Carlos Mendoza’s 205th victory as Mets’ manager. The third-year skipper passed Jerry Manuel and moved into ninth place on the franchise’s wins list.
JJ Bleday drove in Cincinnati's only run on a sacrifice fly with the bases loaded in the third inning to score Jose Trevino. The Reds went 3-3 on their six-game homestand.
Cincinnati went 4-2 against the Mets for the second straight season.
The Mets jumped out to a 3-0 lead in the fourth inning on two-out RBI base hits by Soto, Marcus Semien and Mark Vientos off Cincinnati starter Nick Lodolo (2-2). They broke it open with four in the fifth, including a two-run double by A.J. Ewing to make it 7-1.
Lodolo allowed seven runs and 11 hits in 4 2/3 innings. It is the fourth time in 83 big-league starts he has given up at least seven earned runs.
Reds: RHP Rhett Lowder (3-3, 4.60 ERA) takes the mound in New York on Friday against the Yankees.
How can I watch New York Mets vs. Cincinnati Reds?
- TV Channel: Mets at Reds 2022 MLB Baseball, is broadcasted on MLB.TV.
- Online streaming: Sign up for Fubo.
Scoring Summary
 |
9th Inning | Arroyo grounded out to shortstop. |
|
9th Inning | McLain walked. |
|
9th Inning | Trevino grounded out to pitcher. |
|
9th Inning | Marte doubled to right. |
|
9th Inning | Steer popped out to second. |
 |
9th Inning | Warren relieved Raley |
Statistics
 NYM |
 CIN |
|
|---|---|---|
| 1 | Games Played | 1 |
| 1 | Team Games Played | 1 |
| 0 | Hit By Pitch | 1 |
| 20 | Ground Balls | 14 |
| 4 | Strikeouts | 9 |
| 9 | Runs Batted In | 1 |
| 1 | Sacrifice Hit | 0 |
| 15 | Hits | 5 |
| 0 | Stolen Bases | 0 |
| 3 | Walks | 2 |
| 0 | Catcher Interference | 0 |
| 9 | Runs | 1 |
| 2 | Ground Into Double Play | 0 |
| 1 | Sacrifice Flies | 1 |
| 39 | At Bats | 33 |
| 0 | Home Runs | 0 |
| 0 | Grand Slam Home Runs | 0 |
| 13 | Runners Left On Base | 14 |
| 1 | Triples | 0 |
| 1 | Game Winning RBIs | 0 |
| 0 | Intentional Walks | 0 |
| 2 | Doubles | 4 |
| 17 | Fly Balls | 11 |
| 0 | Caught Stealing | 0 |
| 150 | Pitches | 132 |
| 0 | Games Started | 0 |
| 0 | Pinch At Bats | 1 |
| 0 | Pinch Hits | 0 |
| 0.0 | Player Rating | 0.0 |
| 1 | Is Qualified | 1 |
| 0 | Is Qualified In Steals | 0 |
| 19 | Total Bases | 9 |
| 44 | Plate Appearances | 37 |
| 0.0 | Projected Home Runs | 0.0 |
| 3 | Extra Base Hits | 4 |
| 7.3 | Runs Created | 1.9 |
| .385 | Batting Average | .152 |
| .000 | Pinch Hit Average | .000 |
| .487 | Slugging Percentage | .273 |
| .179 | Secondary Average | .182 |
| .419 | On Base Percentage | .216 |
| .906 | OBP Pct + SLG Pct | .489 |
| 1.2 | Ground To Fly Ball Ratio | 1.3 |
| 7.0 | Runs Created Per 27 Outs | 1.8 |
| 57.5 | Batter Rating | 17.0 |
| 0.0 | At Bats Per Home Run | 0.0 |
| 0.00 | Stolen Base Percentage | 0.00 |
| 3.41 | Pitches Per Plate Appearance | 3.57 |
| .103 | Isolated Power | .121 |
| 0.75 | Walk To Strikeout Ratio | 0.22 |
| .068 | Walks Per Plate Appearance | .054 |
| -.205 | Secondary Average Minus Batting Average | .030 |
| 18.0 | Runs Produced | 2.0 |
| 1.0 | Runs Ratio | 1.0 |
| 0.5 | Patience Ratio | 0.3 |
| 0.4 | Balls In Play Average | 0.2 |
| 105.3 | MLB Rating | 66.8 |
| 0.0 | Offensive Wins Above Replacement | 0.0 |
| 0.0 | Wins Above Replacement | 0.0 |
Game Information
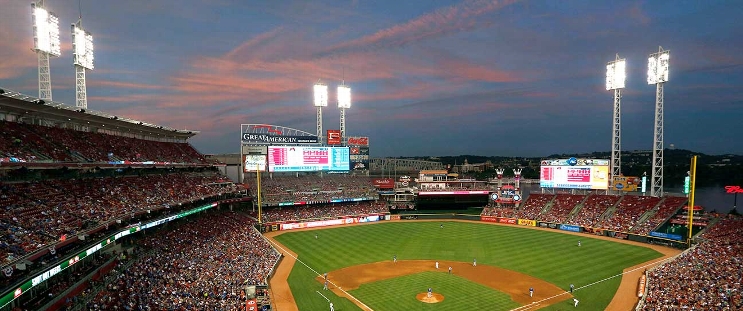
Location: Cincinnati, Ohio
Attendance: 27,207 | Capacity:
2026 National League East Standings
| TEAM | W | L | PCT | GB | STRK |
|---|---|---|---|---|---|
 Atlanta |
- | 68 | L1 | 0.5802469 | 94 |
 Philadelphia |
6 | 74 | W1 | 0.54320985 | 88 |
 Miami |
14 | 82 | W1 | 0.49382716 | 80 |
 Washington |
17 | 85 | W1 | 0.47530866 | 77 |
| New York |
20 | 88 | L1 | 0.45679012 | 74 |
2026 National League Central Standings
| TEAM | W | L | PCT | GB | STRK |
|---|---|---|---|---|---|
 Milwaukee |
- | 59 | W5 | 0.63580245 | 103 |
 Chicago |
14 | 73 | W1 | 0.5493827 | 89 |
 Pittsburgh |
21 | 80 | W1 | 0.50617284 | 82 |
 St. Louis |
26 | 85 | L4 | 0.47530866 | 77 |
| Cincinnati |
28 | 87 | L1 | 0.46296296 | 75 |