
Chicago Cubs at San Francisco Giants
· Major League Baseball
5 - 1

Michael Busch hits 3-run homer to back Javier Assad's strong start, Cubs beat Giants 5-1

Busch's drive was the 176th splash hit at Oracle Park, 68th by an opponent and fourth by a Cubs player — first since Joc Pederson on June 3, 2021.
Seiya Suzuki broke up a scoreless game with an RBI double in the fourth then scored moments later on Nico Hoerner's sacrifice fly.
Assad (4-1) struck out five, walked one and allowed three hits over six innings to win his third straight decision spanning seven starts. His throwing error on a pickoff attempt of Bryce Eldridge in the fourth could have been costly but the right-hander stranded Eldridge on third.
Hoby Milner pitched the seventh and Trent Thornton the final two innings, surrendering Eldridge's one-out homer in the ninth.
Busch greeted reliever Erik Miller with his eighth home run after Chicago put runners aboard on Pete Crow-Armstrong's double and a leadoff walk by Carson Kelly against Giants starter Landen Roupp (5-7). Roupp was tagged for four runs on four hits over 4 2/3 innings.
Chicago won for the third time in its last seven games.
San Francisco had beaten the Cubs 18-3 last Friday then 2-1 in extra innings Sunday — but the Giants dropped to 7-3 overall in the matchups since the start of the 2025 season, outscoring the Cubs 63-35. San Francisco is 6-2 at Oracle Park in the series dating to the beginning of 2024.
Jung Hoo Lee went 0 for 3 and had his career-best 18-game hitting streak snapped — longest by a Giants batter since Angel Pagan hit in 19 in a row from July 31-Aug. 23, 2016.
How can I watch Chicago Cubs vs. San Francisco Giants?
- TV Channel: Cubs at Giants 2022 MLB Baseball, is broadcasted on MLB.TV.
- Online streaming: Sign up for Fubo.
Scoring Summary
 |
9th Inning | Devers struck out looking. |
|
9th Inning | Schmitt struck out swinging. |
|
9th Inning | Eldridge homered to right (377 feet). |
|
9th Inning | Arraez flied out to right. |
 |
9th Inning | Kelly flied out to center. |
|
9th Inning | Ballesteros struck out swinging. |
Statistics
 CHC |
 SF |
|
|---|---|---|
| 1 | Games Played | 1 |
| 1 | Team Games Played | 1 |
| 0 | Hit By Pitch | 0 |
| 8 | Ground Balls | 13 |
| 7 | Strikeouts | 7 |
| 5 | Runs Batted In | 1 |
| 0 | Sacrifice Hit | 0 |
| 6 | Hits | 4 |
| 0 | Stolen Bases | 0 |
| 2 | Walks | 1 |
| 0 | Catcher Interference | 0 |
| 5 | Runs | 1 |
| 0 | Ground Into Double Play | 1 |
| 1 | Sacrifice Flies | 0 |
| 32 | At Bats | 30 |
| 1 | Home Runs | 1 |
| 0 | Grand Slam Home Runs | 0 |
| 8 | Runners Left On Base | 8 |
| 0 | Triples | 0 |
| 1 | Game Winning RBIs | 0 |
| 0 | Intentional Walks | 0 |
| 4 | Doubles | 0 |
| 18 | Fly Balls | 10 |
| 0 | Caught Stealing | 0 |
| 163 | Pitches | 125 |
| 0 | Games Started | 0 |
| 0 | Pinch At Bats | 0 |
| 0 | Pinch Hits | 0 |
| 0.0 | Player Rating | 0.0 |
| 1 | Is Qualified | 1 |
| 0 | Is Qualified In Steals | 0 |
| 13 | Total Bases | 7 |
| 35 | Plate Appearances | 31 |
| 162.0 | Projected Home Runs | 162.0 |
| 5 | Extra Base Hits | 1 |
| 3.2 | Runs Created | 0.2 |
| .188 | Batting Average | .133 |
| .000 | Pinch Hit Average | .000 |
| .406 | Slugging Percentage | .233 |
| .281 | Secondary Average | .133 |
| .229 | On Base Percentage | .161 |
| .635 | OBP Pct + SLG Pct | .395 |
| 0.4 | Ground To Fly Ball Ratio | 1.3 |
| 3.2 | Runs Created Per 27 Outs | 0.2 |
| 37.0 | Batter Rating | 11.0 |
| 32.0 | At Bats Per Home Run | 30.0 |
| 0.00 | Stolen Base Percentage | 0.00 |
| 4.66 | Pitches Per Plate Appearance | 4.03 |
| .219 | Isolated Power | .100 |
| 0.29 | Walk To Strikeout Ratio | 0.14 |
| .057 | Walks Per Plate Appearance | .032 |
| .094 | Secondary Average Minus Batting Average | .000 |
| 10.0 | Runs Produced | 2.0 |
| 1.0 | Runs Ratio | 1.0 |
| 0.4 | Patience Ratio | 0.3 |
| 0.2 | Balls In Play Average | 0.1 |
| 80.5 | MLB Rating | 64.0 |
| 0.0 | Offensive Wins Above Replacement | 0.0 |
| 0.0 | Wins Above Replacement | 0.0 |
Game Information
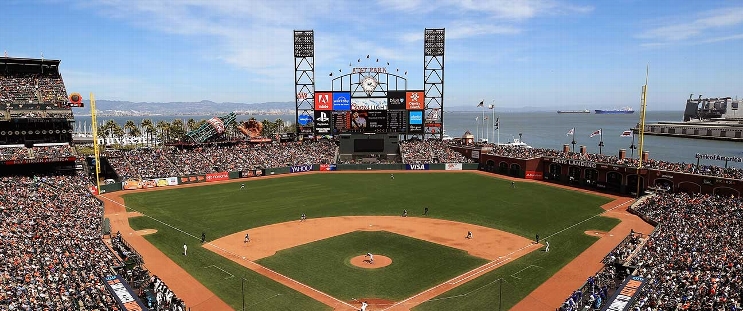
Location: San Francisco, California
Attendance: 38,115 | Capacity:
2026 National League Central Standings
| TEAM | W | L | PCT | GB | STRK |
|---|---|---|---|---|---|
 Milwaukee |
- | 59 | W5 | 0.63580245 | 103 |
| Chicago |
14 | 73 | W1 | 0.5493827 | 89 |
 Pittsburgh |
21 | 80 | W1 | 0.50617284 | 82 |
 St. Louis |
26 | 85 | L4 | 0.47530866 | 77 |
 Cincinnati |
28 | 87 | L1 | 0.46296296 | 75 |
2026 National League West Standings
| TEAM | W | L | PCT | GB | STRK |
|---|---|---|---|---|---|
 Los Angeles |
- | 62 | W3 | 0.61728394 | 100 |
 San Diego |
9 | 71 | W2 | 0.5617284 | 91 |
 Arizona |
14 | 76 | L2 | 0.5308642 | 86 |
| San Francisco |
35 | 97 | L5 | 0.40123457 | 65 |
 Colorado |
42 | 104 | L1 | 0.3580247 | 58 |