
Arizona Diamondbacks at Cincinnati Reds
· Major League Baseball
5 - 2

Dunn's error leads to 3-run 9th, Diamondbacks beat Reds 5-2

With runners on first and second and two outs, Geraldo Perdomo's fly ball to left went off Dunn's glove for an error, and Gabriel Moreno scored to make it 3-2. Jordan Lawlar drove in two more runs with a single.
Lawlar, who was reinstated Friday after missing 61 games with a fractured right wrist, crashed into the center field wall to rob Matt McLain of an extra-base hit in the fourth.
Paul Sewald had his 16th save in 17 chances for Arizona. Kevin Ginkel (2-2) got the win. Brock Burke (2-3) took the loss.
The Reds have dropped seven of eight and 11 of 14.
Eduardo Rodriguez threw 40 pitches in the first inning with three walks but the Reds didn't score despite loading the bases with one out.
Noelvi Marte led off the second with his first home run of the season to put the Reds ahead 1-0. It was Marte's first home run since Sept. 24, 2025, after a 40-game stint at Triple-A this season.
Nolan Arenado's sacrifice fly in the third inning tied it at 1 and snapped a 21-inning scoreless streak for the Diamondbacks.
Rodriguez pitched 2 2/23 innings with one earned run allowed and five walks on 85 pitches.
Lawlar was hit by a pitch from Reds left-hander Nick Lodolo and scored the tying run on LuJames Groover's single in the sixth.
Lodolo allowed two earned runs in 5 1/3 innings with a walk and five strikeouts and hit three batters.
The Diamondbacks had the bases loaded in the eighth but Reds catcher Tyler Stephenson won an ABS challenge and Ketel Marte was called out on strikes to end the inning.
How can I watch Arizona Diamondbacks vs. Cincinnati Reds?
- TV Channel: Diamondbacks at Reds 2022 MLB Baseball, is broadcasted on Apple TV.
- Online streaming: Sign up for Fubo.
Scoring Summary
 |
9th Inning | Stewart grounded out to shortstop. |
|
9th Inning | Bleday flied out to right. |
|
9th Inning | Myers struck out swinging. |
 |
9th Inning | Sewald relieved Ginkel |
|
9th Inning | Barrosa in center field. |
|
9th Inning | Lawlar in left field. |
Statistics
 ARI |
 CIN |
|
|---|---|---|
| 1 | Games Played | 1 |
| 1 | Team Games Played | 1 |
| 3 | Hit By Pitch | 0 |
| 10 | Ground Balls | 9 |
| 6 | Strikeouts | 8 |
| 4 | Runs Batted In | 1 |
| 0 | Sacrifice Hit | 0 |
| 7 | Hits | 4 |
| 5 | Stolen Bases | 1 |
| 5 | Walks | 9 |
| 0 | Catcher Interference | 0 |
| 5 | Runs | 2 |
| 0 | Ground Into Double Play | 1 |
| 1 | Sacrifice Flies | 0 |
| 35 | At Bats | 30 |
| 0 | Home Runs | 1 |
| 0 | Grand Slam Home Runs | 0 |
| 23 | Runners Left On Base | 19 |
| 0 | Triples | 0 |
| 0 | Game Winning RBIs | 0 |
| 1 | Intentional Walks | 1 |
| 2 | Doubles | 1 |
| 20 | Fly Balls | 13 |
| 0 | Caught Stealing | 0 |
| 177 | Pitches | 183 |
| 0 | Games Started | 0 |
| 0 | Pinch At Bats | 0 |
| 0 | Pinch Hits | 0 |
| 0.0 | Player Rating | 0.0 |
| 1 | Is Qualified | 1 |
| 1 | Is Qualified In Steals | 1 |
| 9 | Total Bases | 8 |
| 44 | Plate Appearances | 39 |
| 0.0 | Projected Home Runs | 162.0 |
| 2 | Extra Base Hits | 2 |
| 5.1 | Runs Created | 3.3 |
| .200 | Batting Average | .133 |
| .000 | Pinch Hit Average | .000 |
| .257 | Slugging Percentage | .267 |
| .343 | Secondary Average | .467 |
| .341 | On Base Percentage | .333 |
| .598 | OBP Pct + SLG Pct | .600 |
| 0.5 | Ground To Fly Ball Ratio | 0.7 |
| 4.7 | Runs Created Per 27 Outs | 3.3 |
| 34.0 | Batter Rating | 16.0 |
| 0.0 | At Bats Per Home Run | 30.0 |
| 1.00 | Stolen Base Percentage | 1.00 |
| 4.02 | Pitches Per Plate Appearance | 4.69 |
| .057 | Isolated Power | .133 |
| 0.83 | Walk To Strikeout Ratio | 1.13 |
| .114 | Walks Per Plate Appearance | .231 |
| .143 | Secondary Average Minus Batting Average | .333 |
| 9.0 | Runs Produced | 3.0 |
| 0.8 | Runs Ratio | 0.5 |
| 0.4 | Patience Ratio | 0.5 |
| 0.2 | Balls In Play Average | 0.1 |
| 79.0 | MLB Rating | 68.0 |
| 0.0 | Offensive Wins Above Replacement | 0.0 |
| 0.0 | Wins Above Replacement | 0.0 |
Game Information
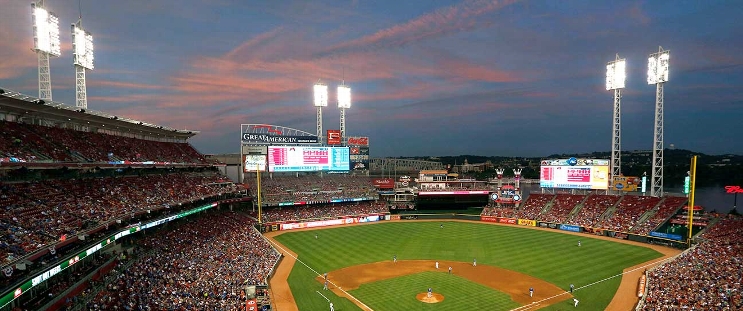
Location: Cincinnati, Ohio
Attendance: 29,803 | Capacity:
2026 National League West Standings
| TEAM | W | L | PCT | GB | STRK |
|---|---|---|---|---|---|
 Los Angeles |
- | 62 | W3 | 0.61728394 | 100 |
 San Diego |
9 | 71 | W2 | 0.5617284 | 91 |
| Arizona |
14 | 76 | L2 | 0.5308642 | 86 |
 San Francisco |
35 | 97 | L5 | 0.40123457 | 65 |
 Colorado |
42 | 104 | L1 | 0.3580247 | 58 |
2026 National League Central Standings
| TEAM | W | L | PCT | GB | STRK |
|---|---|---|---|---|---|
 Milwaukee |
- | 59 | W5 | 0.63580245 | 103 |
 Chicago |
14 | 73 | W1 | 0.5493827 | 89 |
 Pittsburgh |
21 | 80 | W1 | 0.50617284 | 82 |
 St. Louis |
26 | 85 | L4 | 0.47530866 | 77 |
| Cincinnati |
28 | 87 | L1 | 0.46296296 | 75 |