
Cincinnati Reds at New York Mets
· Major League Baseball
7 - 2

Reds rout Mets, who fall 11 under .500 again

The Mets, who ended April at 10-21, have lost five straight to fall to 22-33. They have scored just six runs and collected 25 hits during the losing streak — their second-longest of the season behind a 12-game skid from April 8-21.
Eugenio Suárez and Elly De La Cruz each had two-run doubles off David Peterson (3-5), who also gave up a pair of RBI hits to Tyler Stephenson. Sal Stewart added a run-scoring single in the eighth.
Burns (7-1) allowed two runs and walked two with eight strikeouts. He carried a one-hit shutout into the sixth, when Juan Soto, back after a two-game absence due to illness, delivered a two-run homer.
Burns has a 1.54 ERA over his last four starts to lower his seasonal ERA to 1.96. He hasn’t lost in his last eight starts dating back to April 18.
Peterson gave up six runs and a career-high 11 hits with three walks and four strikeouts in five-plus innings. The 11 hits surrendered were the most allowed by a Mets pitcher since Luis Severino was tagged for 11 hits in five innings on March 30, 2024.
Home plate umpire Emil Jimenez went 2 for 9 on ABS challenges. He lost the first six challenges before a pair of calls — a ball to Spencer Steer and a strike to Suárez — were upheld in the seventh.
How can I watch Cincinnati Reds vs. New York Mets?
- TV Channel: Reds at Mets 2022 MLB Baseball, is broadcasted on MLB.TV.
- Online streaming: Sign up for Fubo.
Scoring Summary
 |
9th Inning | Wagaman grounded out to shortstop. |
|
9th Inning | Vientos grounded out to first. |
|
9th Inning | Ewing grounded out to first. |
 |
9th Inning | Santillan relieved Burke |
|
9th Inning | Stephenson popped out to third. |
|
9th Inning | Bleday struck out looking. |
Statistics
 CIN |
 NYM |
|
|---|---|---|
| 1 | Games Played | 1 |
| 1 | Team Games Played | 1 |
| 0 | Hit By Pitch | 0 |
| 12 | Ground Balls | 7 |
| 12 | Strikeouts | 10 |
| 7 | Runs Batted In | 2 |
| 0 | Sacrifice Hit | 0 |
| 15 | Hits | 5 |
| 0 | Stolen Bases | 0 |
| 5 | Walks | 2 |
| 0 | Catcher Interference | 0 |
| 7 | Runs | 2 |
| 1 | Ground Into Double Play | 1 |
| 0 | Sacrifice Flies | 0 |
| 39 | At Bats | 31 |
| 0 | Home Runs | 1 |
| 0 | Grand Slam Home Runs | 0 |
| 22 | Runners Left On Base | 11 |
| 0 | Triples | 0 |
| 1 | Game Winning RBIs | 0 |
| 0 | Intentional Walks | 0 |
| 3 | Doubles | 1 |
| 15 | Fly Balls | 14 |
| 1 | Caught Stealing | 0 |
| 174 | Pitches | 137 |
| 0 | Games Started | 0 |
| 0 | Pinch At Bats | 2 |
| 0 | Pinch Hits | 0 |
| 0.0 | Player Rating | 0.0 |
| 1 | Is Qualified | 1 |
| 1 | Is Qualified In Steals | 0 |
| 18 | Total Bases | 9 |
| 44 | Plate Appearances | 33 |
| 0.0 | Projected Home Runs | 162.0 |
| 3 | Extra Base Hits | 2 |
| 7.5 | Runs Created | 1.3 |
| .385 | Batting Average | .161 |
| .000 | Pinch Hit Average | .000 |
| .462 | Slugging Percentage | .290 |
| .179 | Secondary Average | .194 |
| .455 | On Base Percentage | .212 |
| .916 | OBP Pct + SLG Pct | .502 |
| 0.8 | Ground To Fly Ball Ratio | 0.5 |
| 7.8 | Runs Created Per 27 Outs | 1.3 |
| 49.0 | Batter Rating | 18.0 |
| 0.0 | At Bats Per Home Run | 31.0 |
| 0.00 | Stolen Base Percentage | 0.00 |
| 3.95 | Pitches Per Plate Appearance | 4.15 |
| .077 | Isolated Power | .129 |
| 0.42 | Walk To Strikeout Ratio | 0.20 |
| .114 | Walks Per Plate Appearance | .061 |
| -.205 | Secondary Average Minus Batting Average | .032 |
| 14.0 | Runs Produced | 4.0 |
| 1.0 | Runs Ratio | 1.0 |
| 0.5 | Patience Ratio | 0.3 |
| 0.6 | Balls In Play Average | 0.2 |
| 98.0 | MLB Rating | 68.5 |
| 0.0 | Offensive Wins Above Replacement | 0.0 |
| 0.0 | Wins Above Replacement | 0.0 |
Game Information
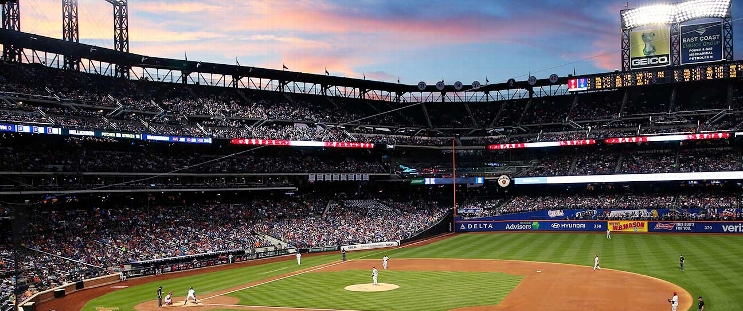
Location: Queens, New York
Attendance: 36,848 | Capacity:
2026 National League Central Standings
| TEAM | W | L | PCT | GB | STRK |
|---|---|---|---|---|---|
 Milwaukee |
- | 59 | W5 | 0.63580245 | 103 |
 Chicago |
14 | 73 | W1 | 0.5493827 | 89 |
 Pittsburgh |
21 | 80 | W1 | 0.50617284 | 82 |
 St. Louis |
26 | 85 | L4 | 0.47530866 | 77 |
| Cincinnati |
28 | 87 | L1 | 0.46296296 | 75 |
2026 National League East Standings
| TEAM | W | L | PCT | GB | STRK |
|---|---|---|---|---|---|
 Atlanta |
- | 68 | L1 | 0.5802469 | 94 |
 Philadelphia |
6 | 74 | W1 | 0.54320985 | 88 |
 Miami |
14 | 82 | W1 | 0.49382716 | 80 |
 Washington |
17 | 85 | W1 | 0.47530866 | 77 |
| New York |
20 | 88 | L1 | 0.45679012 | 74 |