
Cincinnati Reds at New York Mets
· Major League Baseball
7 - 2

Lodolo gets first win this season as Reds extend Mets' skid to 4 with 7-2 victory

Mets star Juan Soto missed his second straight game because of illness and fellow outfielder Tyrone Taylor left with right hip pain after grounding out in the sixth inning. Taylor will undergo an MRI and is probably headed to the injured list, manager Carlos Mendoza said.
The lineup already was without injured regulars Francisco Lindor, Francisco Alvarez, Luis Robert Jr. and Jorge Polanco.
New York has scored four runs and struck out 41 times during its latest skid, dropping to 22-32 at the one-third mark — one shy of its season low of 11 games under .500 at 10-21. A big league-best 45-24 at the start of play on June 13 last year, the Mets are 60-87 since.
Spencer Steer had three RBI for Cincinnati, which beat out the Mets for a playoff spot on the last day of the 2025 season. The Reds started this year 20-11 but are just 8-14 since.
Lodolo (1-1) allowed one run and six hits with seven strikeouts and no walks, lowering his ERA from 7.20 to 5.57. He was sidelined from spring training until May 8 by a blister on his left index finger.
McLean (2-4) was charged with seven runs, five hits, two walks, two hit batters and one wild pitch in 3 1/3 innings, the shortest of his 19 big league starts. He has given up 13 earned runs in his last two outings, raising his ERA from 2.92 to 4.40.
Cincinnati went ahead 2-0 in the second when Steer drove in a run with forceout and McLean bounced a run-scoring wild pitch.
Bleday homered in the third and McLean gave up Steer's two-run single and Stephenson's two-run homer as the Reds took a 7-0 lead in the fourth.
Marcus Semien, hitting cleanup for the first time this year, homered leading off the sixth for the Mets.
Reds shortstop Elly De La Cruz had his 11th four-strikeout game, his first this year.
How can I watch Cincinnati Reds vs. New York Mets?
- TV Channel: Reds at Mets 2022 MLB Baseball, is broadcasted on MLB.TV.
- Online streaming: Sign up for Fubo.
Scoring Summary
 |
9th Inning | Benge grounded out to shortstop. |
|
9th Inning | Torrens struck out swinging. |
|
9th Inning | Tyler Stephenson challenged (pitch result), call on the field was overturned: Brett Baty called out on strikes. |
 |
9th Inning | Ashcraft relieved Moll |
|
9th Inning | Bleday struck out swinging. |
|
9th Inning | De La Cruz struck out looking. |
Statistics
 CIN |
 NYM |
|
|---|---|---|
| 1 | Games Played | 1 |
| 1 | Team Games Played | 1 |
| 2 | Hit By Pitch | 2 |
| 11 | Ground Balls | 16 |
| 15 | Strikeouts | 12 |
| 6 | Runs Batted In | 2 |
| 0 | Sacrifice Hit | 1 |
| 6 | Hits | 9 |
| 0 | Stolen Bases | 0 |
| 4 | Walks | 0 |
| 0 | Catcher Interference | 0 |
| 7 | Runs | 2 |
| 0 | Ground Into Double Play | 0 |
| 0 | Sacrifice Flies | 0 |
| 33 | At Bats | 34 |
| 2 | Home Runs | 1 |
| 0 | Grand Slam Home Runs | 0 |
| 13 | Runners Left On Base | 13 |
| 0 | Triples | 0 |
| 1 | Game Winning RBIs | 0 |
| 0 | Intentional Walks | 0 |
| 2 | Doubles | 1 |
| 7 | Fly Balls | 7 |
| 0 | Caught Stealing | 1 |
| 174 | Pitches | 152 |
| 0 | Games Started | 0 |
| 0 | Pinch At Bats | 0 |
| 0 | Pinch Hits | 0 |
| 0.0 | Player Rating | 0.0 |
| 1 | Is Qualified | 1 |
| 0 | Is Qualified In Steals | 1 |
| 14 | Total Bases | 13 |
| 39 | Plate Appearances | 37 |
| 324.0 | Projected Home Runs | 162.0 |
| 4 | Extra Base Hits | 2 |
| 4.6 | Runs Created | 3.7 |
| .182 | Batting Average | .265 |
| .000 | Pinch Hit Average | .000 |
| .424 | Slugging Percentage | .382 |
| .364 | Secondary Average | .088 |
| .308 | On Base Percentage | .306 |
| .732 | OBP Pct + SLG Pct | .688 |
| 1.6 | Ground To Fly Ball Ratio | 2.3 |
| 4.6 | Runs Created Per 27 Outs | 3.7 |
| 42.0 | Batter Rating | 22.0 |
| 16.5 | At Bats Per Home Run | 34.0 |
| 0.00 | Stolen Base Percentage | 0.00 |
| 4.46 | Pitches Per Plate Appearance | 4.11 |
| .242 | Isolated Power | .118 |
| 0.27 | Walk To Strikeout Ratio | 0.00 |
| .103 | Walks Per Plate Appearance | .000 |
| .182 | Secondary Average Minus Batting Average | -.176 |
| 13.0 | Runs Produced | 4.0 |
| 0.9 | Runs Ratio | 1.0 |
| 0.6 | Patience Ratio | 0.4 |
| 0.3 | Balls In Play Average | 0.4 |
| 83.0 | MLB Rating | 76.3 |
| 0.0 | Offensive Wins Above Replacement | 0.0 |
| 0.0 | Wins Above Replacement | 0.0 |
Game Information
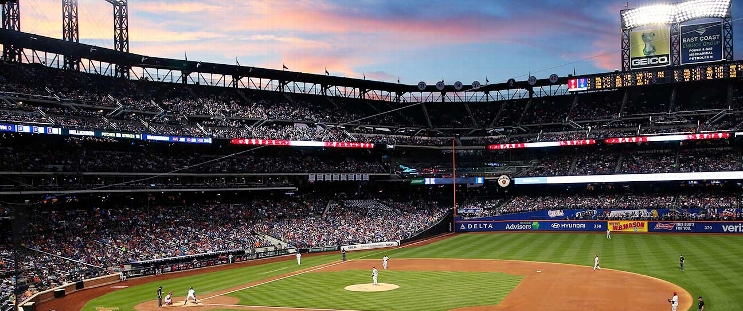
Location: Queens, New York
Attendance: 36,734 | Capacity:
2026 National League Central Standings
| TEAM | W | L | PCT | GB | STRK |
|---|---|---|---|---|---|
 Milwaukee |
- | 59 | W5 | 0.63580245 | 103 |
 Chicago |
14 | 73 | W1 | 0.5493827 | 89 |
 Pittsburgh |
21 | 80 | W1 | 0.50617284 | 82 |
 St. Louis |
26 | 85 | L4 | 0.47530866 | 77 |
| Cincinnati |
28 | 87 | L1 | 0.46296296 | 75 |
2026 National League East Standings
| TEAM | W | L | PCT | GB | STRK |
|---|---|---|---|---|---|
 Atlanta |
- | 68 | L1 | 0.5802469 | 94 |
 Philadelphia |
6 | 74 | W1 | 0.54320985 | 88 |
 Miami |
14 | 82 | W1 | 0.49382716 | 80 |
 Washington |
17 | 85 | W1 | 0.47530866 | 77 |
| New York |
20 | 88 | L1 | 0.45679012 | 74 |