
Pittsburgh Pirates at San Francisco Giants
· Major League Baseball
13 - 3

Pirates get a season-high 20 hits and beat the Giants 13-3

Every Pittsburgh starter recorded a hit. Oneil Cruz finished with three hits, while Lowe and Ryan O’Hearn each had two.
Braxton Ashcraft (2-2) went seven innings, allowing six hits and striking out six. Landon Roupp (5-3) struck out eight and gave up one run in four-plus innings before the Pirates pounced on the Giants' bullpen.
Ryan Borucki replaced Roupp after a leadoff single by Bart in the fifth and but got just two outs before manager Tony Vitello pulled him in favor of Ryan Walker, who got San Francisco out of the inning.
Bryce Eldridge, the Giants' 21-year-old designated hitter, quickly answered with a solo home run in the bottom of the fifth, his first in the majors, after getting the call-up from Sacramento earlier this week.
However, Walker surrendered two runs on back-to-back hits from Konnor Griffin and Bart, putting the Pirates ahead 4-1 in the sixth.
And in the seventh, the Pirates piled it on, getting four runs off JT Brubaker and then two more off Gregory Santos to take a 10-1 lead, garnering loud boos from Giants fans.
Giants second baseman Christian Koss left in the ninth inning after getting hit by a pitch on the shoulder.
How can I watch Pittsburgh Pirates vs. San Francisco Giants?
- TV Channel: Pirates at Giants 2022 MLB Baseball, is broadcasted on MLB.TV.
- Online streaming: Sign up for Fubo.
Scoring Summary
 |
9th Inning | Lee lined out to left. |
|
9th Inning | Haase singled to left, Porter scored, Gilbert to second, Chapman to third. |
|
9th Inning | Gilbert walked, Ramos scored, Chapman to second, Porter to third. |
|
9th Inning | Chapman walked, Porter to second, Ramos to third. |
|
9th Inning | Adames flied out to left. |
|
9th Inning | Eldridge lined out to second. |
Statistics
 PIT |
 SF |
|
|---|---|---|
| 1 | Games Played | 1 |
| 1 | Team Games Played | 1 |
| 0 | Hit By Pitch | 1 |
| 18 | Ground Balls | 8 |
| 11 | Strikeouts | 7 |
| 12 | Runs Batted In | 3 |
| 0 | Sacrifice Hit | 0 |
| 20 | Hits | 7 |
| 1 | Stolen Bases | 0 |
| 5 | Walks | 3 |
| 0 | Catcher Interference | 0 |
| 13 | Runs | 3 |
| 1 | Ground Into Double Play | 1 |
| 2 | Sacrifice Flies | 0 |
| 44 | At Bats | 33 |
| 0 | Home Runs | 1 |
| 0 | Grand Slam Home Runs | 0 |
| 21 | Runners Left On Base | 16 |
| 1 | Triples | 0 |
| 1 | Game Winning RBIs | 0 |
| 0 | Intentional Walks | 0 |
| 4 | Doubles | 0 |
| 17 | Fly Balls | 18 |
| 1 | Caught Stealing | 0 |
| 232 | Pitches | 124 |
| 0 | Games Started | 0 |
| 0 | Pinch At Bats | 0 |
| 0 | Pinch Hits | 0 |
| 0.0 | Player Rating | 0.0 |
| 1 | Is Qualified | 1 |
| 1 | Is Qualified In Steals | 0 |
| 26 | Total Bases | 10 |
| 51 | Plate Appearances | 37 |
| 0.0 | Projected Home Runs | 162.0 |
| 5 | Extra Base Hits | 1 |
| 11.6 | Runs Created | 2.8 |
| .455 | Batting Average | .212 |
| .000 | Pinch Hit Average | .000 |
| .591 | Slugging Percentage | .303 |
| .250 | Secondary Average | .182 |
| .490 | On Base Percentage | .297 |
| 1.081 | OBP Pct + SLG Pct | .600 |
| 1.1 | Ground To Fly Ball Ratio | 0.4 |
| 11.2 | Runs Created Per 27 Outs | 2.8 |
| 81.5 | Batter Rating | 22.0 |
| 0.0 | At Bats Per Home Run | 33.0 |
| 0.50 | Stolen Base Percentage | 0.00 |
| 4.55 | Pitches Per Plate Appearance | 3.35 |
| .136 | Isolated Power | .091 |
| 0.45 | Walk To Strikeout Ratio | 0.43 |
| .098 | Walks Per Plate Appearance | .081 |
| -.205 | Secondary Average Minus Batting Average | -.030 |
| 25.0 | Runs Produced | 6.0 |
| 0.9 | Runs Ratio | 1.0 |
| 0.6 | Patience Ratio | 0.4 |
| 0.6 | Balls In Play Average | 0.2 |
| 123.0 | MLB Rating | 74.8 |
| 0.0 | Offensive Wins Above Replacement | 0.0 |
| 0.0 | Wins Above Replacement | 0.0 |
Game Information
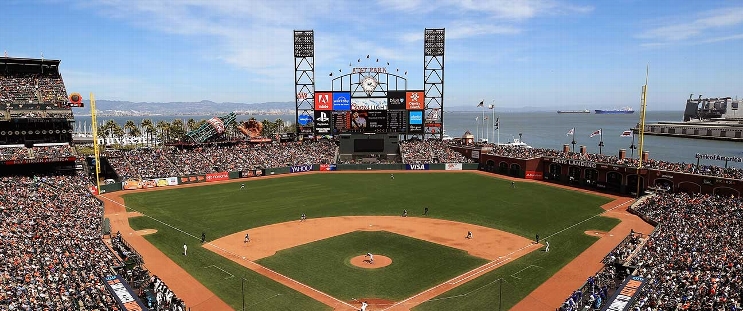
Location: San Francisco, California
Attendance: 40,417 | Capacity:
2026 National League Central Standings
| TEAM | W | L | PCT | GB | STRK |
|---|---|---|---|---|---|
 Milwaukee |
- | 59 | W5 | 0.63580245 | 103 |
 Chicago |
14 | 73 | W1 | 0.5493827 | 89 |
| Pittsburgh |
21 | 80 | W1 | 0.50617284 | 82 |
 St. Louis |
26 | 85 | L4 | 0.47530866 | 77 |
 Cincinnati |
28 | 87 | L1 | 0.46296296 | 75 |
2026 National League West Standings
| TEAM | W | L | PCT | GB | STRK |
|---|---|---|---|---|---|
 Los Angeles |
- | 62 | W3 | 0.61728394 | 100 |
 San Diego |
9 | 71 | W2 | 0.5617284 | 91 |
 Arizona |
14 | 76 | L2 | 0.5308642 | 86 |
| San Francisco |
35 | 97 | L5 | 0.40123457 | 65 |
 Colorado |
42 | 104 | L1 | 0.3580247 | 58 |