
Boston Red Sox at Texas Rangers
· Major League Baseball
3 - 5

Texas Rangers rally for 5-3 victory over Boston Red Sox
Isiah Kiner-Falefa homered to help Texas take three of four games against the AL East leaders and win consecutive games for the first time since April 18-19. Josh Sborz (3-1) got three outs for the win, and Ian Kennedy worked the ninth for his seventh save in seven opportunities.
Xander Bogaerts had three hits for Boston, including his fifth homer. Verdugo finished with two hits.
The Red Sox built a 3-1 lead with runs in the second, fourth and seventh innings.
Bogaerts scored the game's first run after he reached on a towering popup that second baseman Nick Solak lost in the sun. He advanced to third on Marwin Gonzalez’s double and scampered home on Hunter Renfroe’s grounder to Solak.
Bogaerts connected in the fourth against Mike Foltynewicz. But the Rangers got one back in the seventh on Kiner-Falefa's homer and went ahead to stay in the eighth.
How can I watch Boston Red Sox vs. Texas Rangers?
- TV Channel: Red Sox at Rangers 2022 MLB Baseball, is broadcasted on MLB.tv.
- Online streaming: Sign up for Fubo.
Scoring Summary
 |
9th Inning | Cordero flied out to left. |
|
9th Inning | Renfroe fouled out to first. |
|
9th Inning | Gonzalez flied out to left. |
 |
9th Inning | Kennedy relieved Sborz |
|
8th Inning | Trevino grounded out to shortstop. |
|
8th Inning | Holt singled to center, Dahl scored on error and Kiner-Falefa scored on fielding error by center fielder Verdugo, Holt to second. |
Statistics
 BOS |
 TEX |
|
|---|---|---|
| 1 | Games Played | 1 |
| 1 | Team Games Played | 1 |
| 1 | Hit By Pitch | 0 |
| 9 | Ground Balls | 12 |
| 7 | Strikeouts | 10 |
| 3 | Runs Batted In | 4 |
| 1 | Sacrifice Hit | 0 |
| 9 | Hits | 9 |
| 0 | Stolen Bases | 2 |
| 1 | Walks | 3 |
| 0 | Catcher Interference | 0 |
| 3 | Runs | 5 |
| 2 | Ground Into Double Play | 0 |
| 0 | Sacrifice Flies | 0 |
| 32 | At Bats | 33 |
| 1 | Home Runs | 1 |
| 0 | Grand Slam Home Runs | 0 |
| 14 | Runners Left On Base | 15 |
| 0 | Triples | 0 |
| 0 | Game Winning RBIs | 1 |
| 0 | Intentional Walks | 0 |
| 2 | Doubles | 1 |
| 17 | Fly Balls | 11 |
| 1 | Caught Stealing | 0 |
| 116 | Pitches | 149 |
| 0 | Games Started | 0 |
| 0 | Pinch At Bats | 0 |
| 0 | Pinch Hits | 0 |
| 0.0 | Player Rating | 0.0 |
| 1 | Is Qualified | 1 |
| 1 | Is Qualified In Steals | 1 |
| 14 | Total Bases | 13 |
| 35 | Plate Appearances | 36 |
| 162.0 | Projected Home Runs | 162.0 |
| 3 | Extra Base Hits | 2 |
| 3.5 | Runs Created | 4.9 |
| .281 | Batting Average | .273 |
| .000 | Pinch Hit Average | .000 |
| .438 | Slugging Percentage | .394 |
| .156 | Secondary Average | .273 |
| .324 | On Base Percentage | .333 |
| .761 | OBP Pct + SLG Pct | .727 |
| 0.5 | Ground To Fly Ball Ratio | 1.1 |
| 3.5 | Runs Created Per 27 Outs | 5.5 |
| 28.0 | Batter Rating | 34.0 |
| 32.0 | At Bats Per Home Run | 33.0 |
| 0.00 | Stolen Base Percentage | 1.00 |
| 3.31 | Pitches Per Plate Appearance | 4.14 |
| .156 | Isolated Power | .121 |
| 0.14 | Walk To Strikeout Ratio | 0.30 |
| .029 | Walks Per Plate Appearance | .083 |
| -.125 | Secondary Average Minus Batting Average | .000 |
| 6.0 | Runs Produced | 9.0 |
| 1.0 | Runs Ratio | 0.8 |
| 0.5 | Patience Ratio | 0.5 |
| 0.3 | Balls In Play Average | 0.4 |
| 81.0 | MLB Rating | 82.8 |
| 0.0 | Offensive Wins Above Replacement | 0.0 |
| 0.0 | Wins Above Replacement | 0.0 |
Game Information
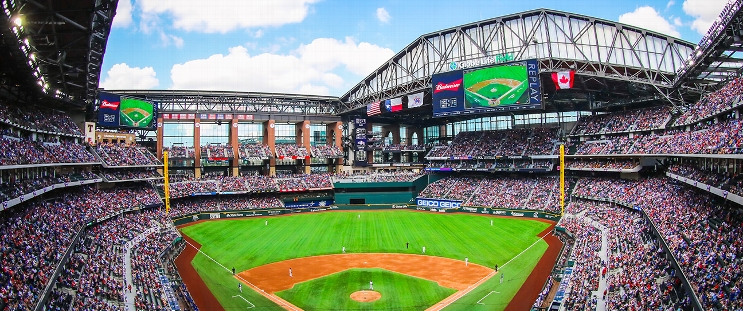
Location: Arlington, Texas
Attendance: 29,190 | Capacity:
2026 American League East Standings
| TEAM | W | L | PCT | GB | STRK |
|---|---|---|---|---|---|
 Tampa Bay |
- | 64 | L1 | 0.60493827 | 98 |
 New York |
4.5 | 68 | W1 | 0.57763976 | 93 |
| Boston |
11 | 75 | L1 | 0.537037 | 87 |
 Baltimore |
18.5 | 82 | L1 | 0.49068323 | 79 |
 Toronto |
19 | 83 | W1 | 0.48765433 | 79 |
2026 American League West Standings
| TEAM | W | L | PCT | GB | STRK |
|---|---|---|---|---|---|
 Houston |
- | 81 | W2 | 0.5 | 81 |
| Texas |
1 | 82 | L1 | 0.49382716 | 80 |
 Seattle |
5 | 86 | W2 | 0.4691358 | 76 |
 Athletics |
17 | 98 | L2 | 0.39506173 | 64 |
 Los Angeles |
19 | 100 | L2 | 0.38271606 | 62 |