
Cleveland Indians at Kansas City Royals
· Major League Baseball
Cleveland Indians
1-0, 1-0 Away
Final
9 - 5
9 - 5

Kansas City Royals
0-2, 0-2 HomeHow To Watch
How can I watch Cleveland Indians vs. Kansas City Royals?
- TV Channel: Indians at Royals 2022 MLB Baseball, is broadcasted on MLB.tv.
- Online streaming: Sign up for Fubo.
Scoring Summary
 |
9th Inning | Heath flied out to center. |
|
9th Inning | Isbel scored on throwing error by third baseman Monasterio, Reynolds safe at second on throwing error by third baseman Monasterio, Phillips safe at third on throwing error by third baseman Monasterio. |
|
9th Inning | Melendez hit sacrifice fly to center, Gutiérrez scored. |
|
9th Inning | Phillips walked, Isbel to second. |
|
9th Inning | Isbel walked. |
|
9th Inning | Isbel hit for Jones |
Statistics
 CLE |
 KC |
|
|---|---|---|
| 1 | Games Played | 1 |
| 1 | Team Games Played | 1 |
| 1 | Hit By Pitch | 0 |
| 0 | Ground Balls | 0 |
| 8 | Strikeouts | 8 |
| 8 | Runs Batted In | 4 |
| 0 | Sacrifice Hit | 0 |
| 12 | Hits | 5 |
| 0 | Stolen Bases | 2 |
| 5 | Walks | 5 |
| 0 | Catcher Interference | 0 |
| 9 | Runs | 5 |
| 0 | Ground Into Double Play | 1 |
| 0 | Sacrifice Flies | 1 |
| 39 | At Bats | 31 |
| 2 | Home Runs | 1 |
| 0 | Grand Slam Home Runs | 0 |
| 15 | Runners Left On Base | 14 |
| 0 | Triples | 0 |
| 0 | Game Winning RBIs | 0 |
| 0 | Intentional Walks | 0 |
| 3 | Doubles | 1 |
| 0 | Fly Balls | 0 |
| 0 | Caught Stealing | 1 |
| 0 | Pitches | 0 |
| 0 | Games Started | 0 |
| 0 | Pinch At Bats | 0 |
| 0 | Pinch Hits | 0 |
| 0.0 | Player Rating | 0.0 |
| 1 | Is Qualified | 1 |
| 0 | Is Qualified In Steals | 1 |
| 21 | Total Bases | 9 |
| 45 | Plate Appearances | 37 |
| 324.0 | Projected Home Runs | 162.0 |
| 5 | Extra Base Hits | 2 |
| 8.4 | Runs Created | 2.4 |
| .308 | Batting Average | .161 |
| .000 | Pinch Hit Average | .000 |
| .538 | Slugging Percentage | .290 |
| .359 | Secondary Average | .323 |
| .400 | On Base Percentage | .270 |
| .938 | OBP Pct + SLG Pct | .561 |
| 0.0 | Ground To Fly Ball Ratio | 0.0 |
| 8.4 | Runs Created Per 27 Outs | 2.3 |
| 58.0 | Batter Rating | 30.0 |
| 19.5 | At Bats Per Home Run | 31.0 |
| 0.00 | Stolen Base Percentage | 0.67 |
| 0.00 | Pitches Per Plate Appearance | 0.00 |
| .231 | Isolated Power | .129 |
| 0.63 | Walk To Strikeout Ratio | 0.63 |
| .111 | Walks Per Plate Appearance | .135 |
| .051 | Secondary Average Minus Batting Average | .161 |
| 17.0 | Runs Produced | 9.0 |
| 0.9 | Runs Ratio | 0.8 |
| 0.6 | Patience Ratio | 0.4 |
| 0.3 | Balls In Play Average | 0.2 |
| 101.8 | MLB Rating | 75.3 |
| 0.0 | Offensive Wins Above Replacement | 0.0 |
| 0.0 | Wins Above Replacement | 0.0 |
Game Information
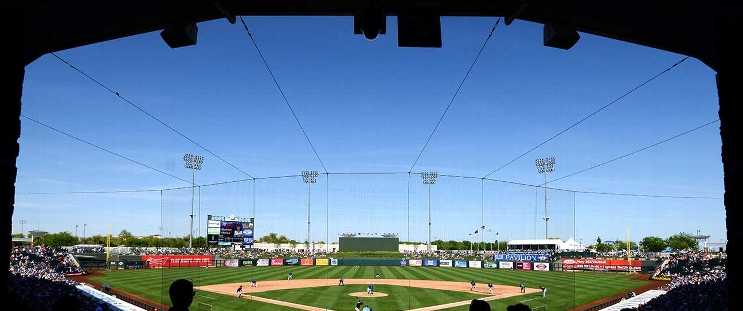
Surprise Stadium
Location: Surprise, Arizona
Attendance: 4,465 | Capacity:
2026 American League Central Standings
| TEAM | W | L | PCT | GB | STRK |
|---|---|---|---|---|---|
| Cleveland |
- | 77 | L1 | 0.52469134 | 85 |
 Chicago |
1 | 78 | W1 | 0.5185185 | 84 |
 Minnesota |
8 | 85 | W1 | 0.47530866 | 77 |
 Detroit |
9 | 86 | L1 | 0.4691358 | 76 |
| Kansas City |
16 | 93 | W1 | 0.42592594 | 69 |